Chapter 5 Analyze the Experiment
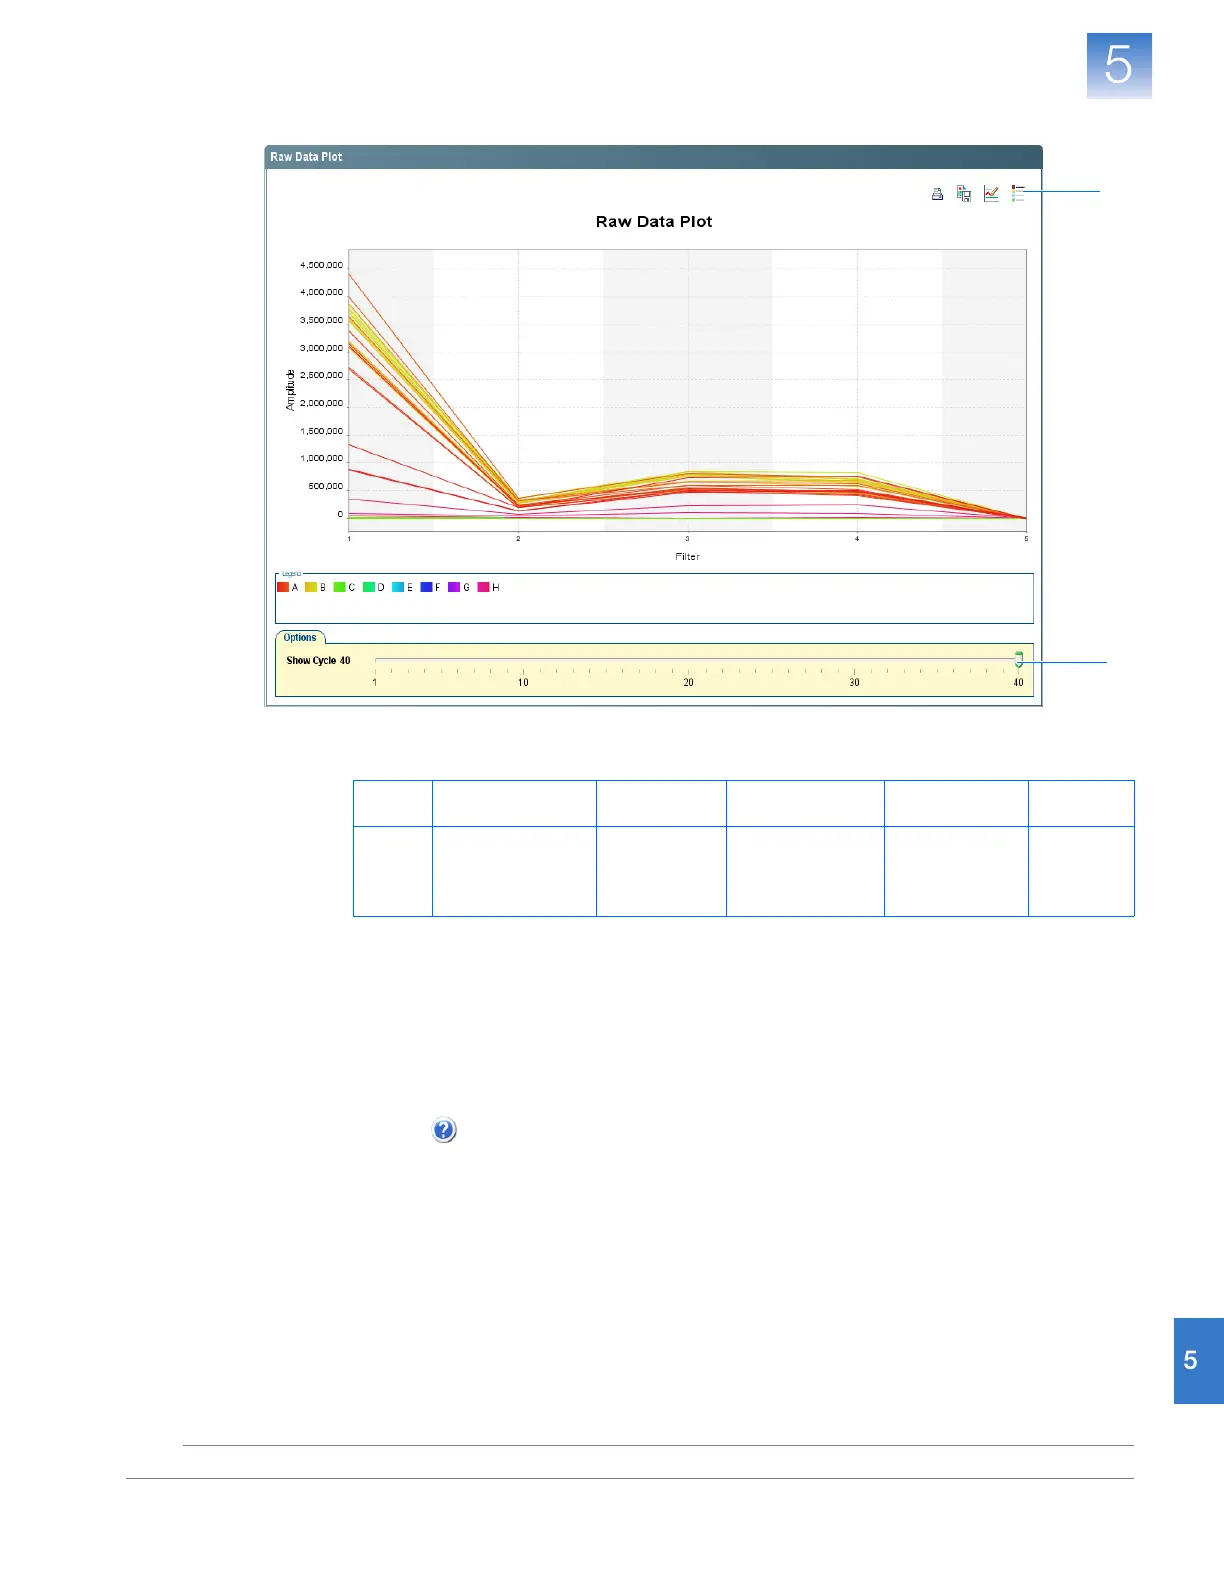
View the Raw Data Plot
95
Applied Biosystems 7500/7500 Fast Real-Time PCR System Getting Started Guide for Standard Curve
Experiments
Notes
The filters are:
Analysis
Guidelines
When you analyze your own standard curve experiment, look for the following in each
filter:
• Characteristic signal growth
• No abrupt changes or dips
For More
Information
For more information on the Raw Data Plot screen, open the 7500 Software Help by
clicking or pressing F1.
3
4
Filter
123 45
Dye
•FAM
™
dye
• SYBR
®
Green
dye
•JOE
™
dye
•VIC
®
dye
•TAMRA
™
dye
•NED
™
dye
•Cy3
®
dye
•ROX
™
dye
• Texas Red
®
dye
Cy5
®
dye
 Loading...


