Chapter 4 Run the Experiment
Monitor the Run
Applied Biosystems 7500/7500 Fast Real-Time PCR System Getting Started Guide for Standard Curve
Experiments
62
Notes
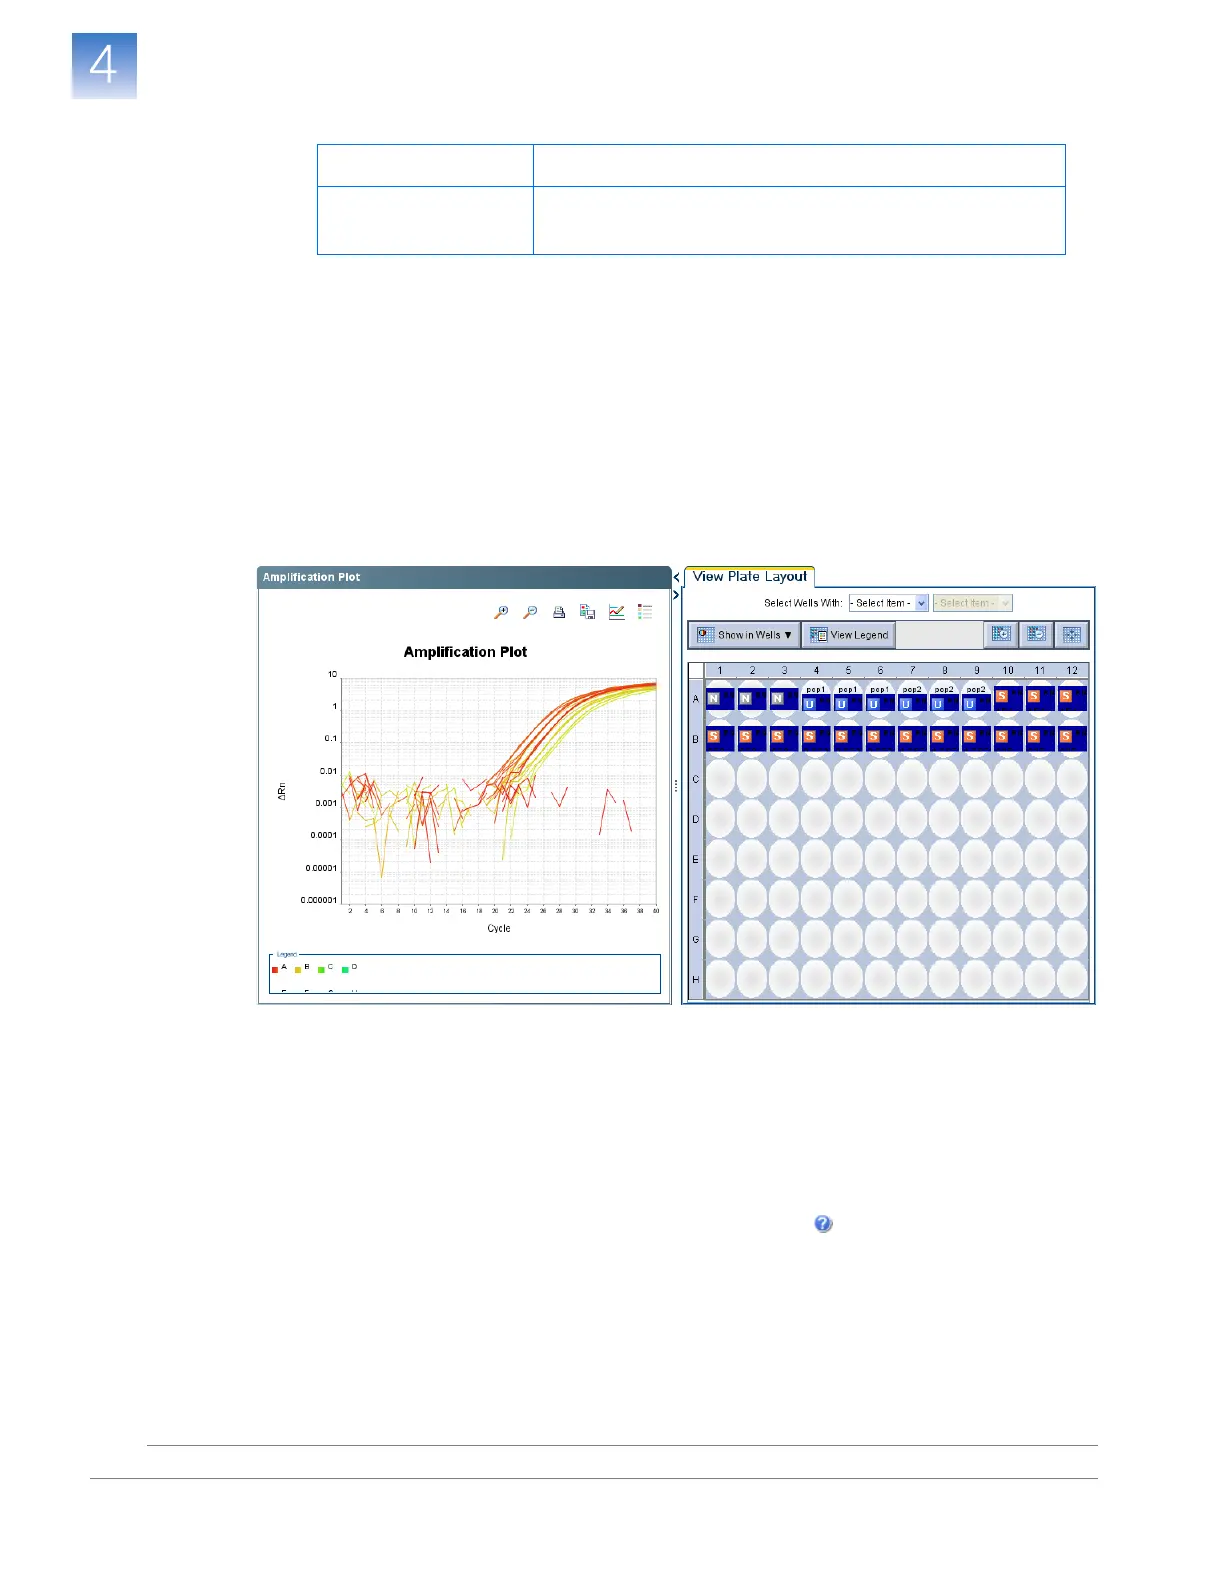
About the Amplification Plot Screen
The screen displays sample amplification as your instrument collects fluorescence data
during a run. If a method is set up to collect real-time data, the Amplification Plot screen
displays the data for the wells selected in the View Plate Layout tab. The plot displays
normalized dye fluorescence (∆Rn) as a function of cycle number. The figure below
shows the Amplification Plot screen as it appears during the example experiment.
To view data in the Amplification Plot screen, select the wells that you want to view in
the View Plate Layout tab.
The Amplification Plot screen is useful for identifying and examining abnormal
amplification. Abnormal amplification can include:
• Increased fluorescence in negative control wells.
• Absence of detectable fluorescence at an expected cycle (determined from previous
similar experiments that were run using the same reagents under the same conditions).
If you notice abnormal amplification or a complete absence of florescence, troubleshoot
the error as explained in the 7500 Software Help (click or press F1).
Enable/disable the
Notification Settings
Select or deselect Enable Notifications.
See “Enable the Notification Settings (Optional)” on page 59.
To… A ct i on
 Loading...


