Portable Test Equipment
User’s Guide
www.appliedp.com PTE-UGFW56a-EN
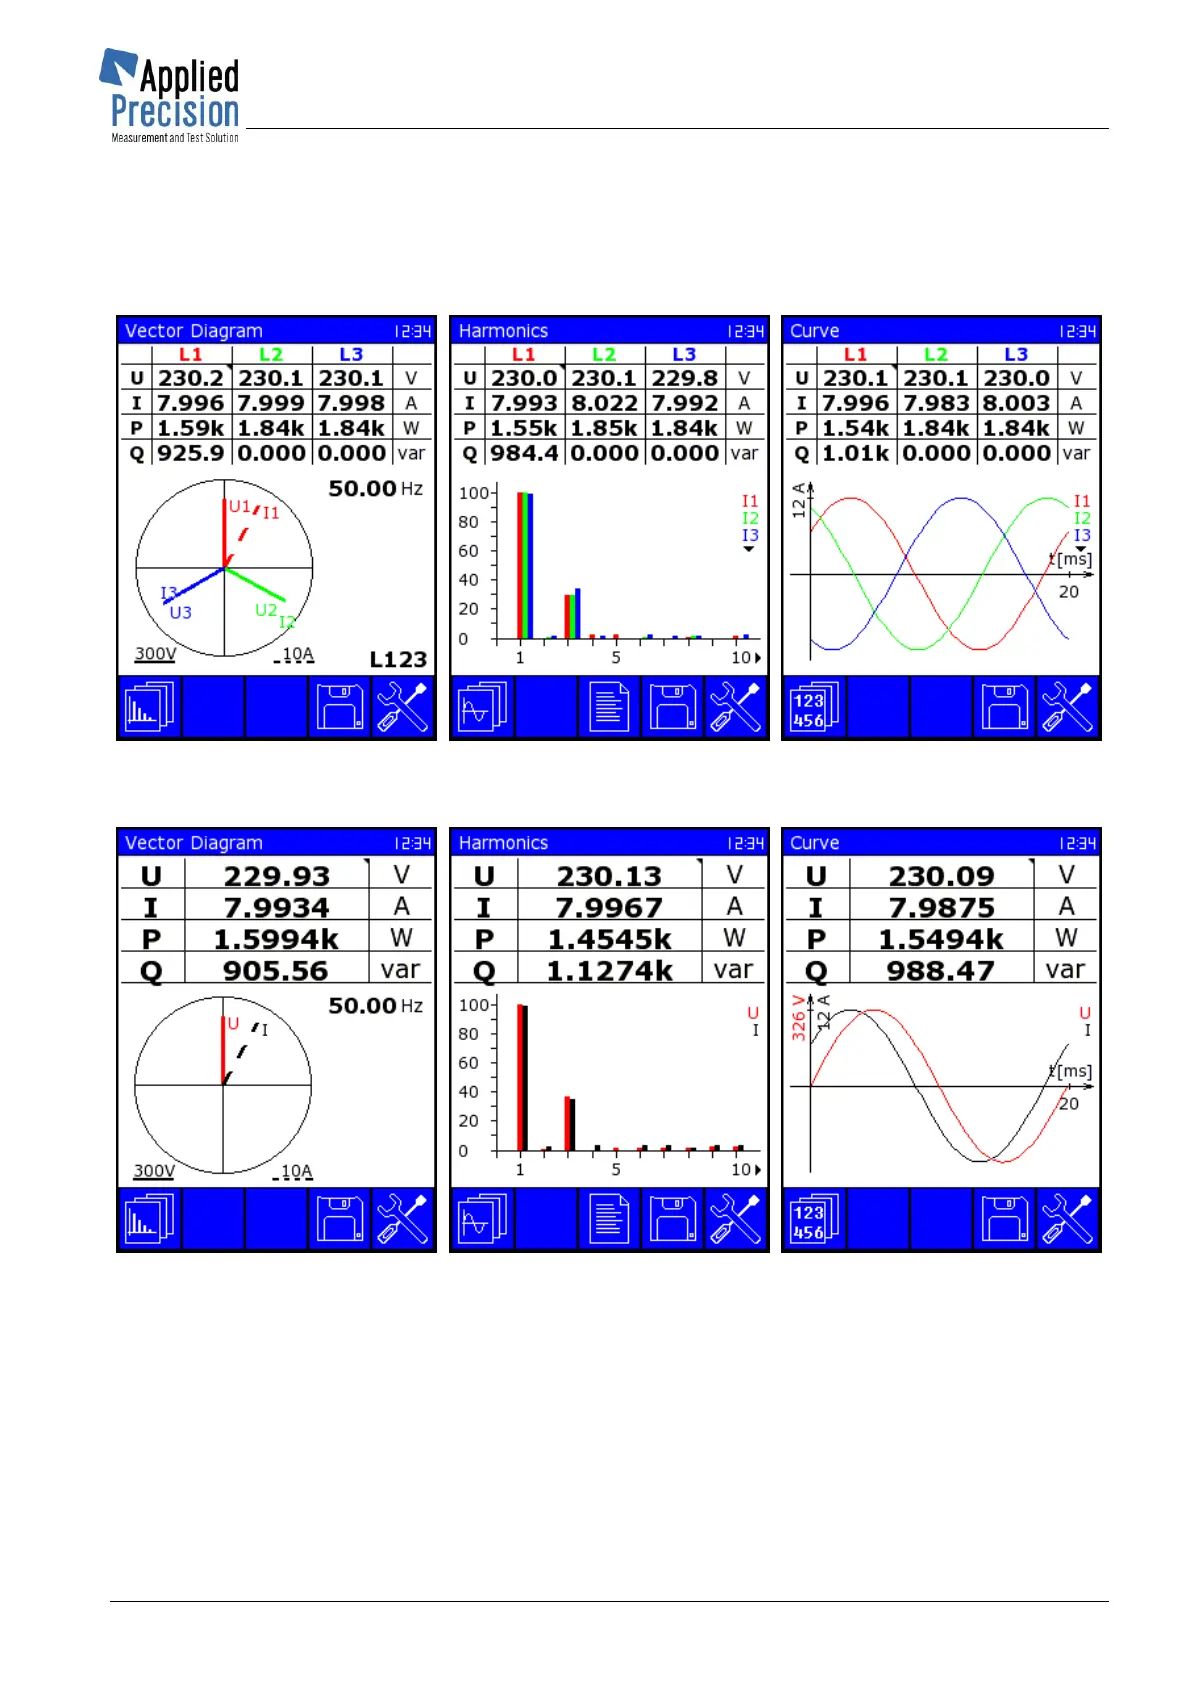
5.1.3 Graphical Presentation
The way of display the measurement results can be switched by pressing the F1 key repeatedly.
Graphical Presentation screens for 3f:
Vector Diagram screen
* P02
Graphical Presentation screens for 1f:
Vector Diagram screen
* P49
Vector diagram has two parameters which can be configured in Measurement Settings:
- position of reference zero axis (vertical or horizontal)
- reference unit (voltage or current) which is displayed on reference zero axis
Harmonics screen shows harmonics up to 31
st
harmonic. 10 harmonics are displayed on one screen.
Scrolling to other harmonics can be done by ◄ ► arrow keys.
Combination of showed signals (I1+I2+I3, U1+U2+U3, U1+I1, U2+I2 or U3+I3) can be in Harmonics
and Curve screens chosen by ▼▲ arrow keys.
Little back triangle in top right corner in one of the voltage or current values determines the
synchronization frequency channel.
 Loading...