32
(4-2-2) An Example of How to Create Data Table
To create a data table, first prepare sample solutions of different concentrations.
Then, use an accurate refractometer to measure their refractive indices at different temperatures.
This chapter explains the procedure of creating a data table for caustic soda (NaOH) solutions.
[Items to prepare]
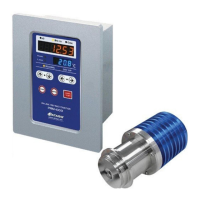
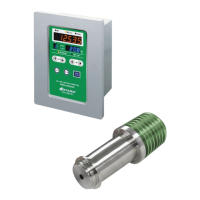
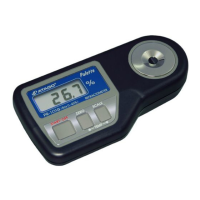
・ATAGO RX-5000α Cat.No. 3261 - A precision refractometer (with an internal constant temperature feature,
if possible)
・A circulating constant temperature bath (unnecessary for a refractometer with an internal constant
temperature feature)
・Sample solutions of different concentrations (example: NaOH solutions)
①Prepare 6 NaOH solutions diluted with distilled water to the following concentrations:
0.00%, 10.00%, 20.00%, 30.00%, 40.00%, 50.00%
Use distilled water as the 0.00% sample.
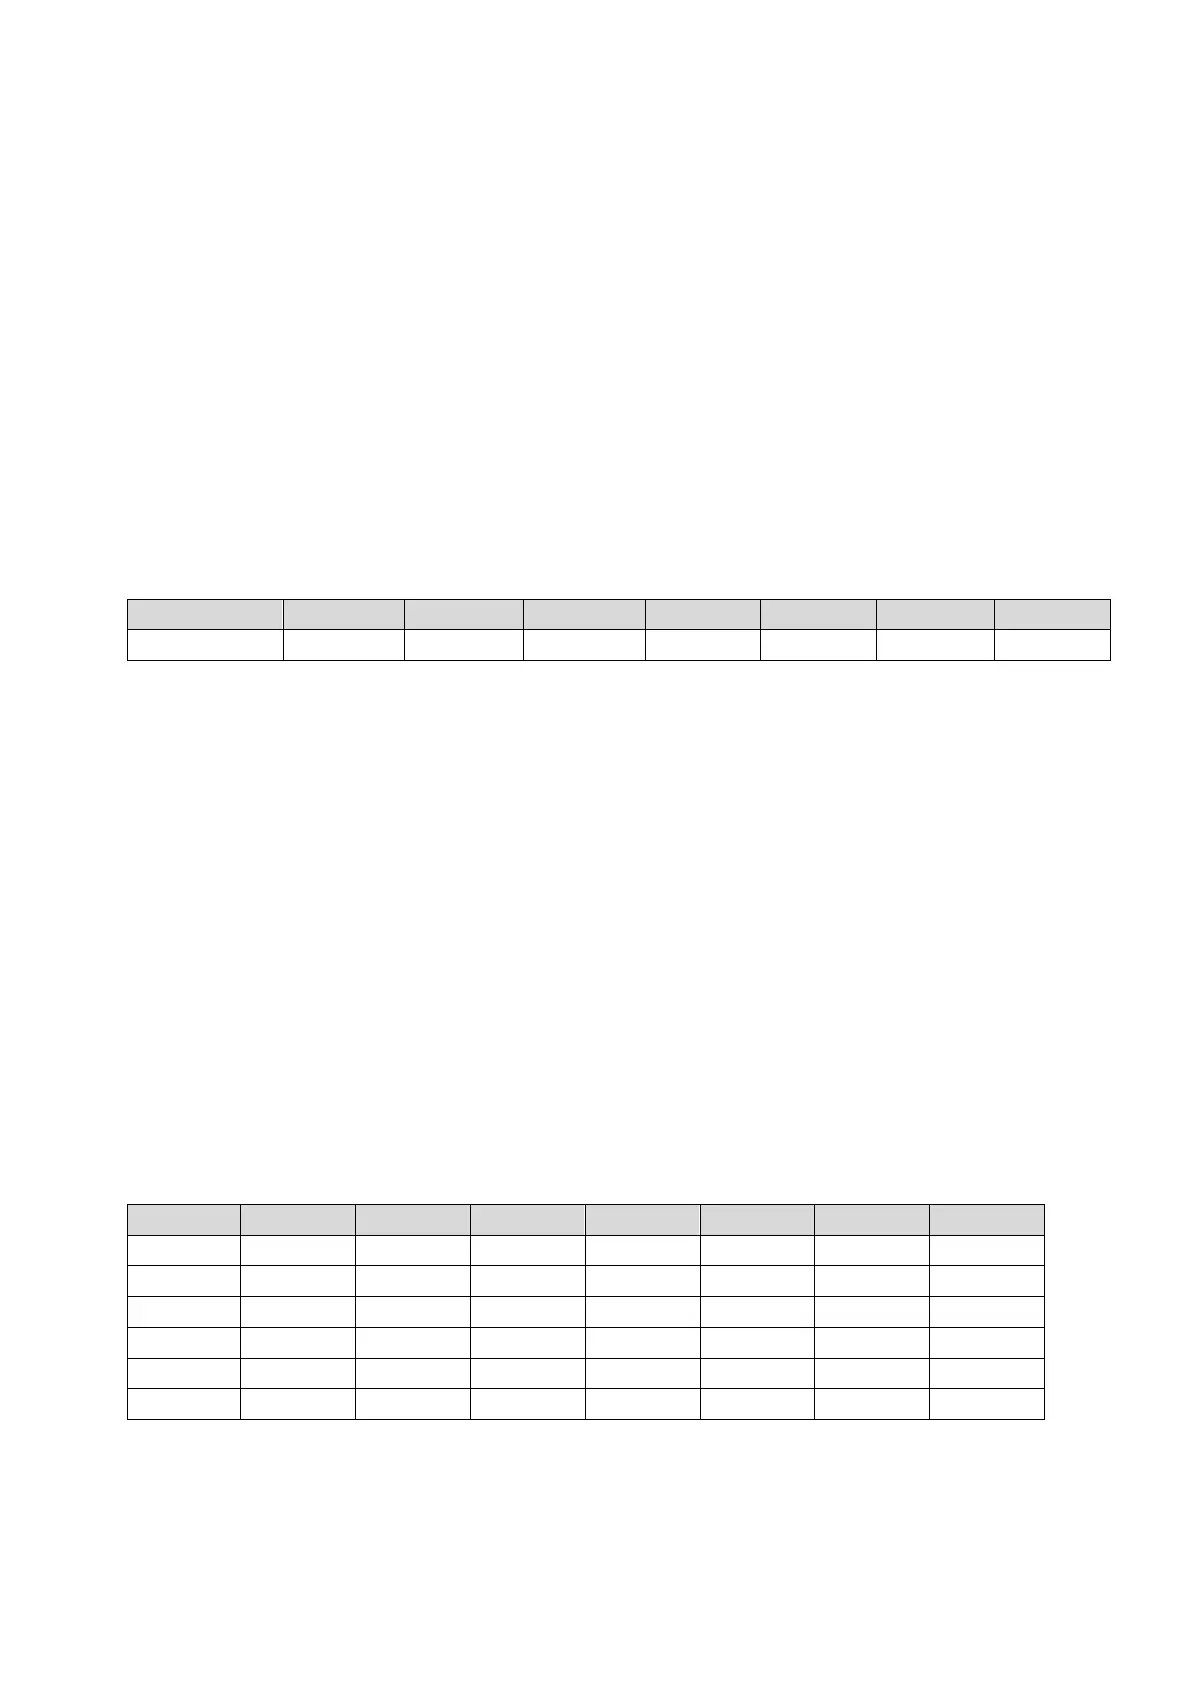
Table 11-2 is the data of conversion between temperature and refractive index of water.
Table 11-2
②Next, measure the other 5 NaOH solutions with the refractometer.
Change the temperature to 5.0˚C, 10.0˚C, 20.0˚C, 30.0˚C, and 40.0˚C and measure.
Record the concentration, temperature, and Refractive Index.
m For a data table, use a measurement range that is wider than the range of the actual sample the
PRM-100α will be measuring.
Accordingly, the user scale in this case has the temperature range of 5 to 40˚C and the
concentration range of 0.00 to 50.00%.
③Enter the concentration, Refractive Index, and temperature, following the data table format.
The Table 11-3 below is the compilation of the measurement results of the NaOH solutions expressed in
the format of theTable 11-2.
How to read the Table 11-3:
The 20.00% solution measures nD 1.38310 at 20 ˚C.
The 30.00% solution measures nD 1.40570 at 10 ˚C.
Table 11-3
※Fill in any blank cells with "0.0"