10-37
d) The sample interval is equal to the product of the
Scan Rate
and the
Drop
Time
(or
Step Period
) (e.g., the default value is 6 mV.)
Graphics Menu
Single Graph
displays the appropriate current vs. potential plot for all the
techniques.
Analysis Menu
The
Auto
option for
Results Graph
displays the current vs. potential plot,
and the peak potential and peak current are listed in the
Main
window for
ACV/P
and
PSACV/P
. It is disabled for
SHACV/P
. Alternative baselines can
be set by the user through the
Manual
option.
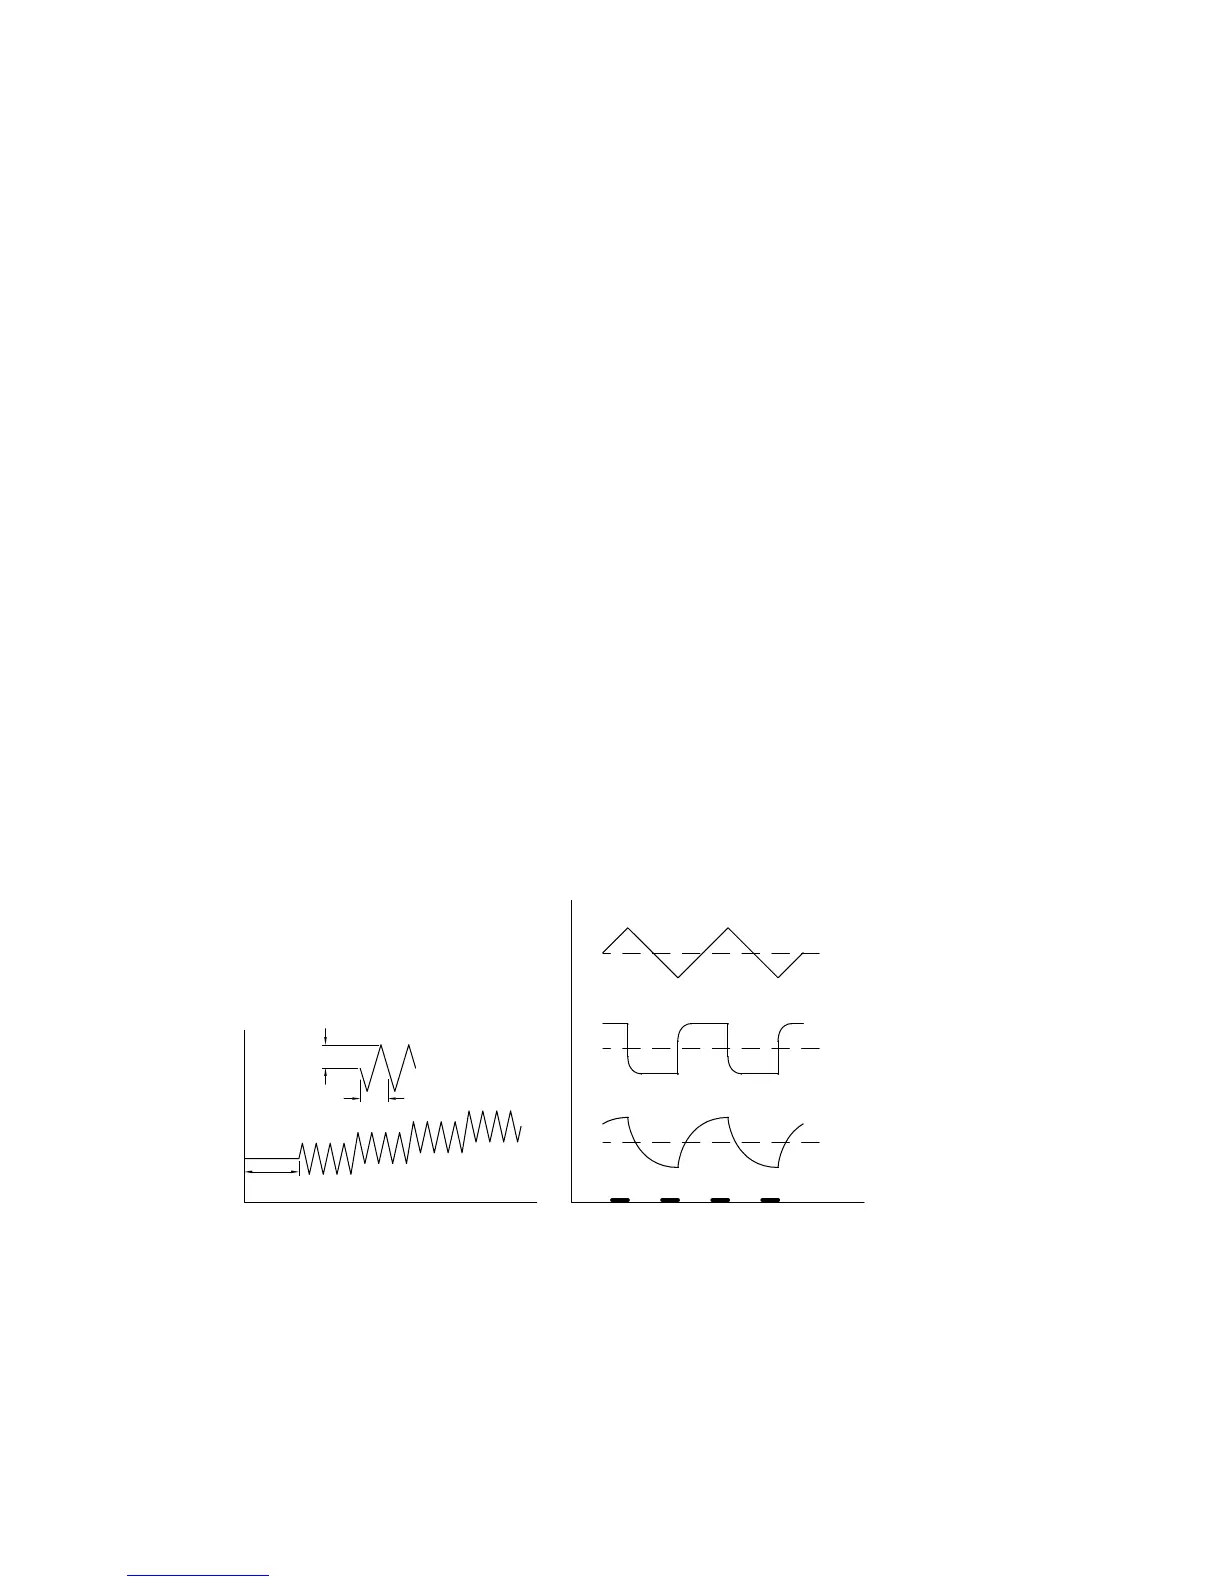
Triangular Wave A.C. Techniques (TACV/P, DTACV/P)
These techniques are similar to the sinusoidal techniques in that the potential
waveform consists of an A.C. waveform superimposed on a slowly varying D.C.
waveform. However, for these techniques, the A.C. waveform is triangular (Figure
10-23). The A.C. current response is therefore more simple, and is shown in Figure
10-23 and Figure 10-24. The charging (capacitive) current approximates to a square
wave, the amplitude of which is proportional to the double-layer capacitance.
Triangular wave A.C. techniques were originally used to measure double-layer
capacitance; more recently, there have also been used in corrosion studies.
E
QUIET
TIME
T.W. AMPLITUDE
PERIOD
APPLIED POTENTIAL
E
ac
CAPACITIVE CURRENT
I
dc
FARADAIC CURRENT
I
dc
SAMPLING TIME
t
t
A. B.
Figure 10-23.
Potential wave form and current sampling regime for
TACV/P
.