10-69
12. Z' - Z"/
13. -Z" & Z' - 1/Sqrt(
)
14. Cot
θ
- Sqrt(
)
One of the most difficult aspects of impedance measurements is the interpretation of
the experimental data. The basic approach is that components of the electrochemical
cells can be modeled as components of an electronic circuit. For example, the
interfacial region is similar to a capacitor of capacitance C
dl
and there is an
uncompensated solution resistance of R
u
between the working and reference
electrodes. Other components of the electrochemical cell that are modeled include the
electron transfer (Faradaic impedance) and the diffusion mass transport (Warburg
impedance).
The rationale behind the Faradaic impedance is as follows. If the applied potential
(i.e., the A.C. amplitude) is small (ca. 5/n mV where n is the number of electrons
transferred), then the relationship between the applied potential and the current
response is linear; that is, I = E/R
f
where R
f
is the Faradaic impedance. R
f
is inversely
proportional to the rate of electron transfer.
The simplest model of an electrochemical system therefore has 3 components: C
dl
, R
u
and R
f
. R
u
is in series with a parallel combination of C
dl
and R
f
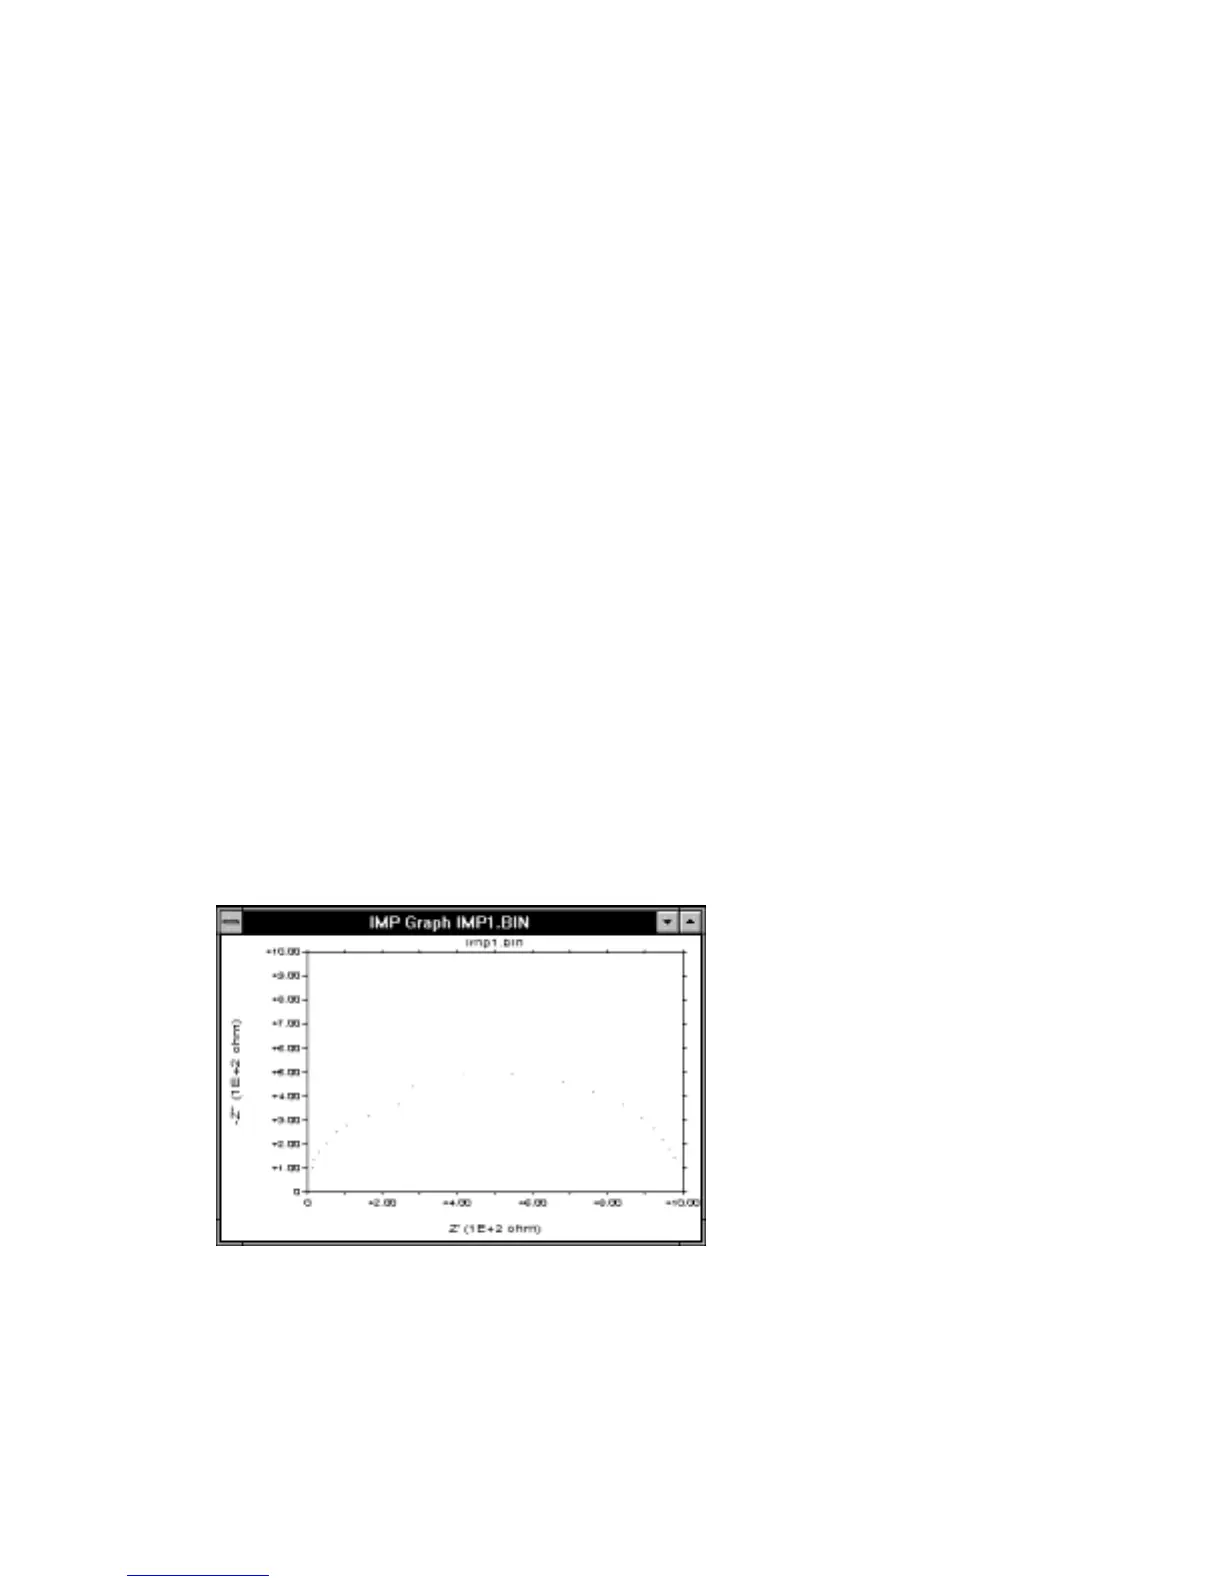
. The Nyquist plot for
this RC circuit is also shown in Figure 10-45, and consists of a semi-circle. The lower
intercept on the Z' axis is at Z' = R
u
and the higher intercept is at Z' = R
u
+ R
f
. The
frequency which gives the largest -Z" value on the semi-circle equals 1/ R
u
C
dl
.
Therefore, all three components of this simple RC circuit can be calculated from
impedance measurements.
Figure 10-45.
Typical Nyquist plot.
The above simple model corresponds to a situation where the electrochemical
behavior is controlled by the rate of electron transfer (i.e., the electron transfer
kinetics are slow). At the other extreme where the electrochemical reaction is
diffusion-controlled, the Nyquist plot consists of a straight line of unity slope. For