10-14
E
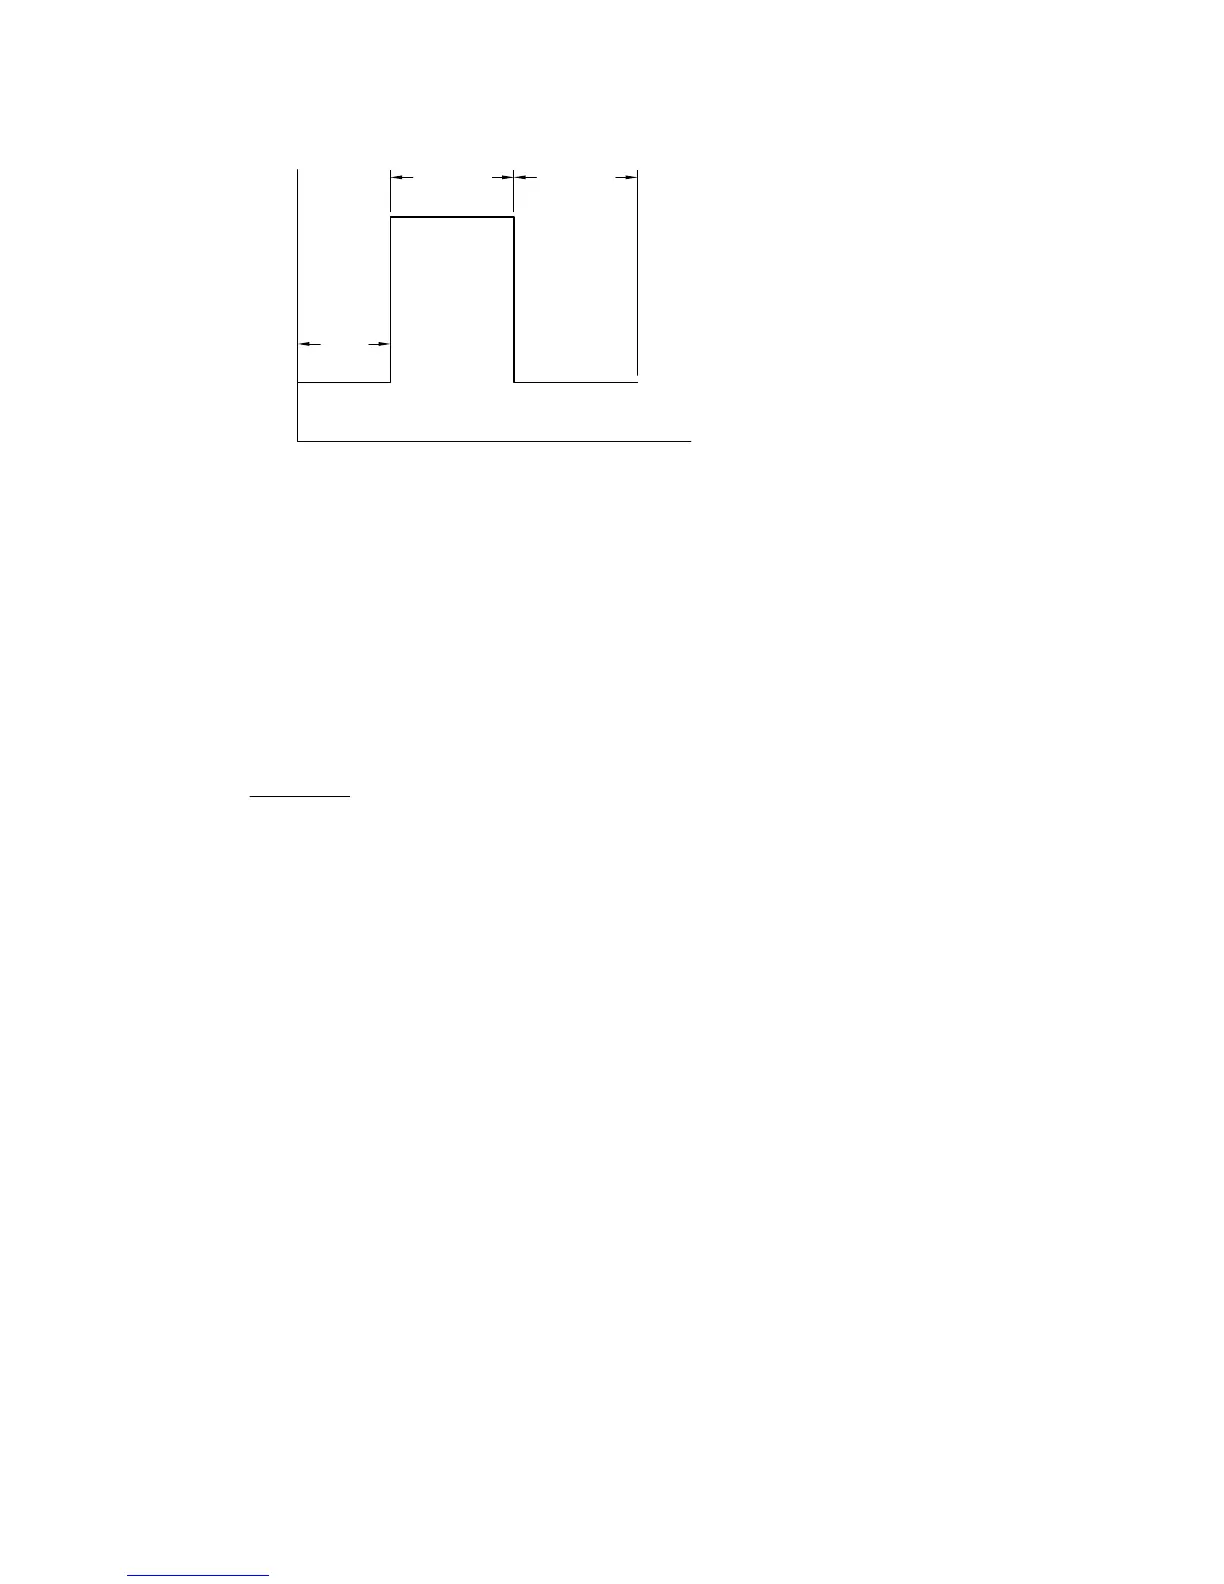
PULSE
WIDTH
FINAL E
INIT. E
t
PULSE
WIDTH
QUIET
TIME
Figure 10-5.
Potential wave form for
CC
.
Often, the initial potential is a potential at which no faradaic reaction occurs, and the
final potential is a potential at which the Faradaic reaction occurs very rapidly; that is,
the electroactive molecules are electrolyzed as soon as they arrive at the surface of
the working electrode. The current is therefore determined by the rate of mass
transport
from the bulk solution to the surface of the working electrode; that is, the rate of
diffusion. The diffusion controlled current is given by the Cottrell equation.
i
nFAD C
t
=
12
12 12
/
//
π
where: i = current (A)
n = number of electrons transferred per molecule
F = Faraday`s constant (96,485 C/eq)
A = electrode area (cm
2
)
D = diffusion coefficient (cm
2
/s)
C = concentration (mol/cm
3
)
t = time (s)
The diffusion controlled faradaic current therefore decays with t
-1/2
(a typical
chronoamperogram is shown in Figure 10-6). The analogous expression for the
diffusion controlled charge (Q
diff
) is the integral of the above expression (i.e., Q
diff
is
proportional to t
1/2
), and a typical chronocoulogram is shown in Figure 10-7.
Although i (or Q) vs. t plot is displayed during the experimental run, it is also useful
to plot i vs. t
-1/2
(for
CA
) and Q vs. t
1/2
(for
CC
). For diffusion controlled systems,
these are straight line plots, and are often referred to as the Cottrell plot (for
CA
) and
the Anson plot (for
CC
). These plots are available as standard plots on the BAS
100B/W.