10-15
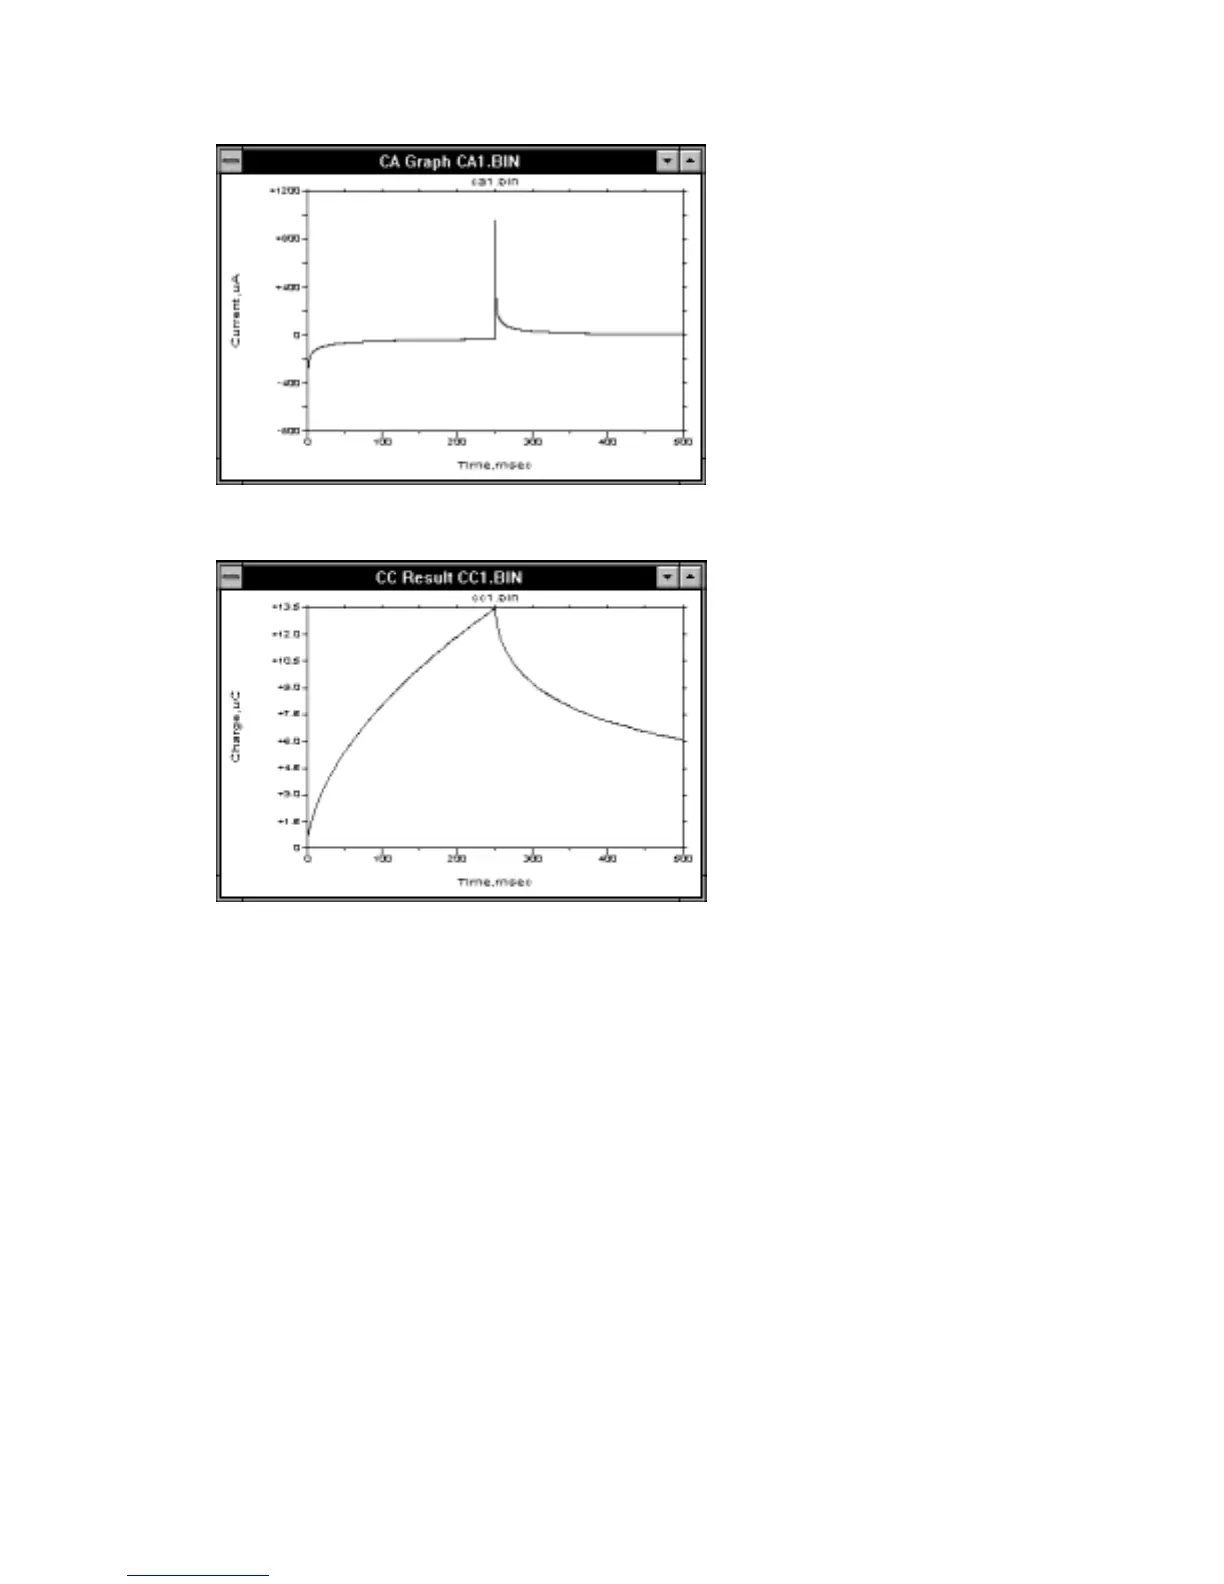
Figure 10-6.
Chronoamperogram (current-time) response for double-potential-step
CA
.
Figure 10-7.
Chronocoulogram (charge-time) response for double-potential-step
CC
.
Therefore, both
CA
and
CC
can be used to measure one of n, C, A and D using the
gradients of these straight line plots, provided the other three constants are known.
However, other techniques (e.g., pulse techniques) have lower detection limits, so
CA
and
CC
are generally not used for concentration measurements. However, A and D
are frequently measured using these techniques (1-3).
The relationship between i and t
-1/2
(or Q and t
1/2
) can be used to investigate the
period of time for which the current (or charge) is strictly controlled by diffusion.
Figure 10-8 shows a plot of i/t
-1/2
vs. time. The deviation from ideality at short times
is due to the finite length of time required to charge the working electrode to the step
potential. The deviations at long times are due to natural convection.