01/10 347 LB 444 K-40
31
linear
<enter>.
The calibration is carried out.
The coefficient is calculated by the program.
The calculated zero count rate Io and the coefficient a1 and the square error are
displayed.
If necessary, enter a factor, by which the measured values are multiplied.
If necessary, enter an offset which is added to the measured values.
Push <done> to return to submenu group.
If the current output limits change (see page 26), calculate the calibration curve once
more. (Pos. 16.).
When entering the concentration values, you need not observe a falling or rising order.
However, you must make sure that the correlation of count rate/concentration value is
correct.
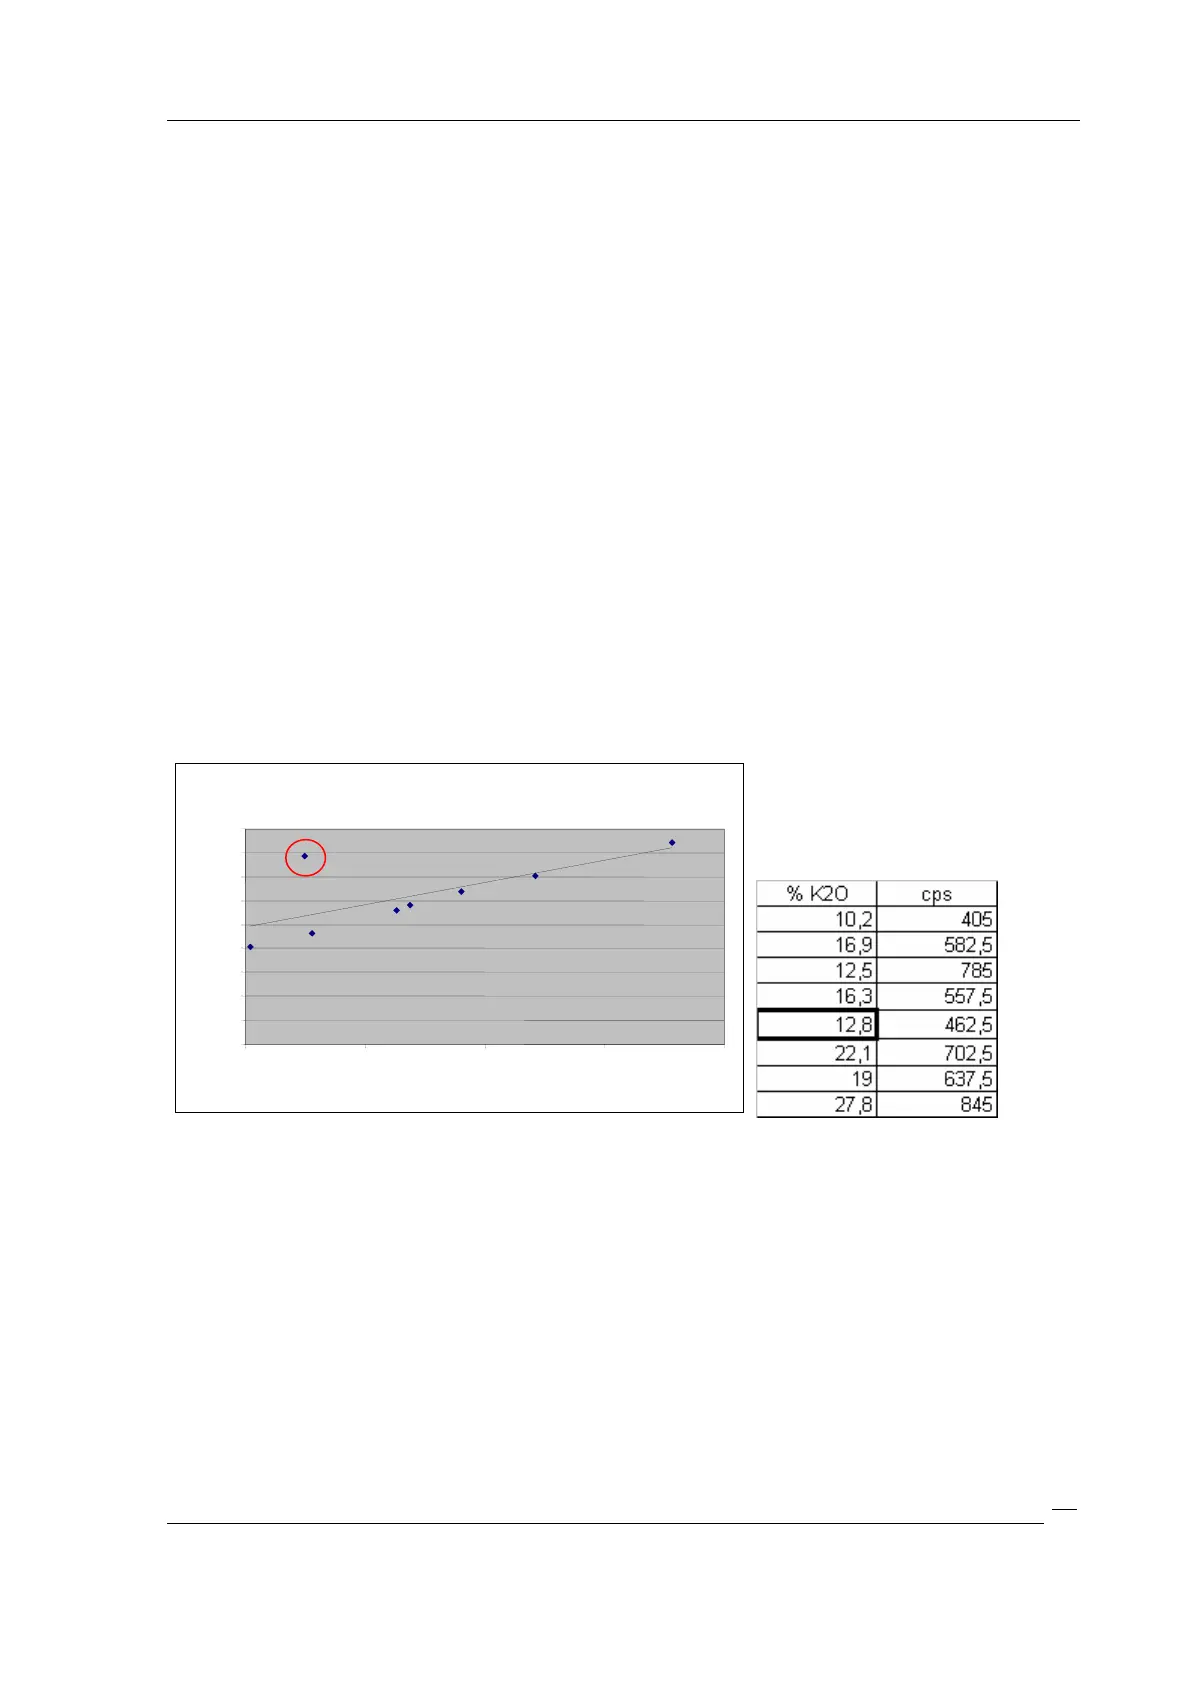
7.2.3 Checking the Calibration
To discover errors during calibration, the calibration curve can be plotted, e.g. with
EXCEL.
Figure 12: Calibration curve
Thus, errors in the calibration (marking) can be detected more easily.
Remedy: Correct or clear values and calculate calibration curve once more.
7.3 Live Display
Start measurement: Push <run>.
Stoop measurement: Push <run> again.
Result display % K20:
Calibration curve
0
100
200
300
400
500
600
700
800
900
10
15
20
25
30
% K2O
cps
 Loading...