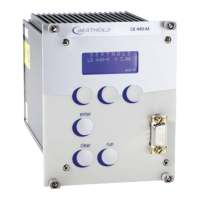
01/10 347 LB 444 K-40
34
Response
-3 2 7 12 17 22 27 32 37 42 47 52 57 62 67 72 77 82 87 92 97
0
20
40
60
80
100
T in s
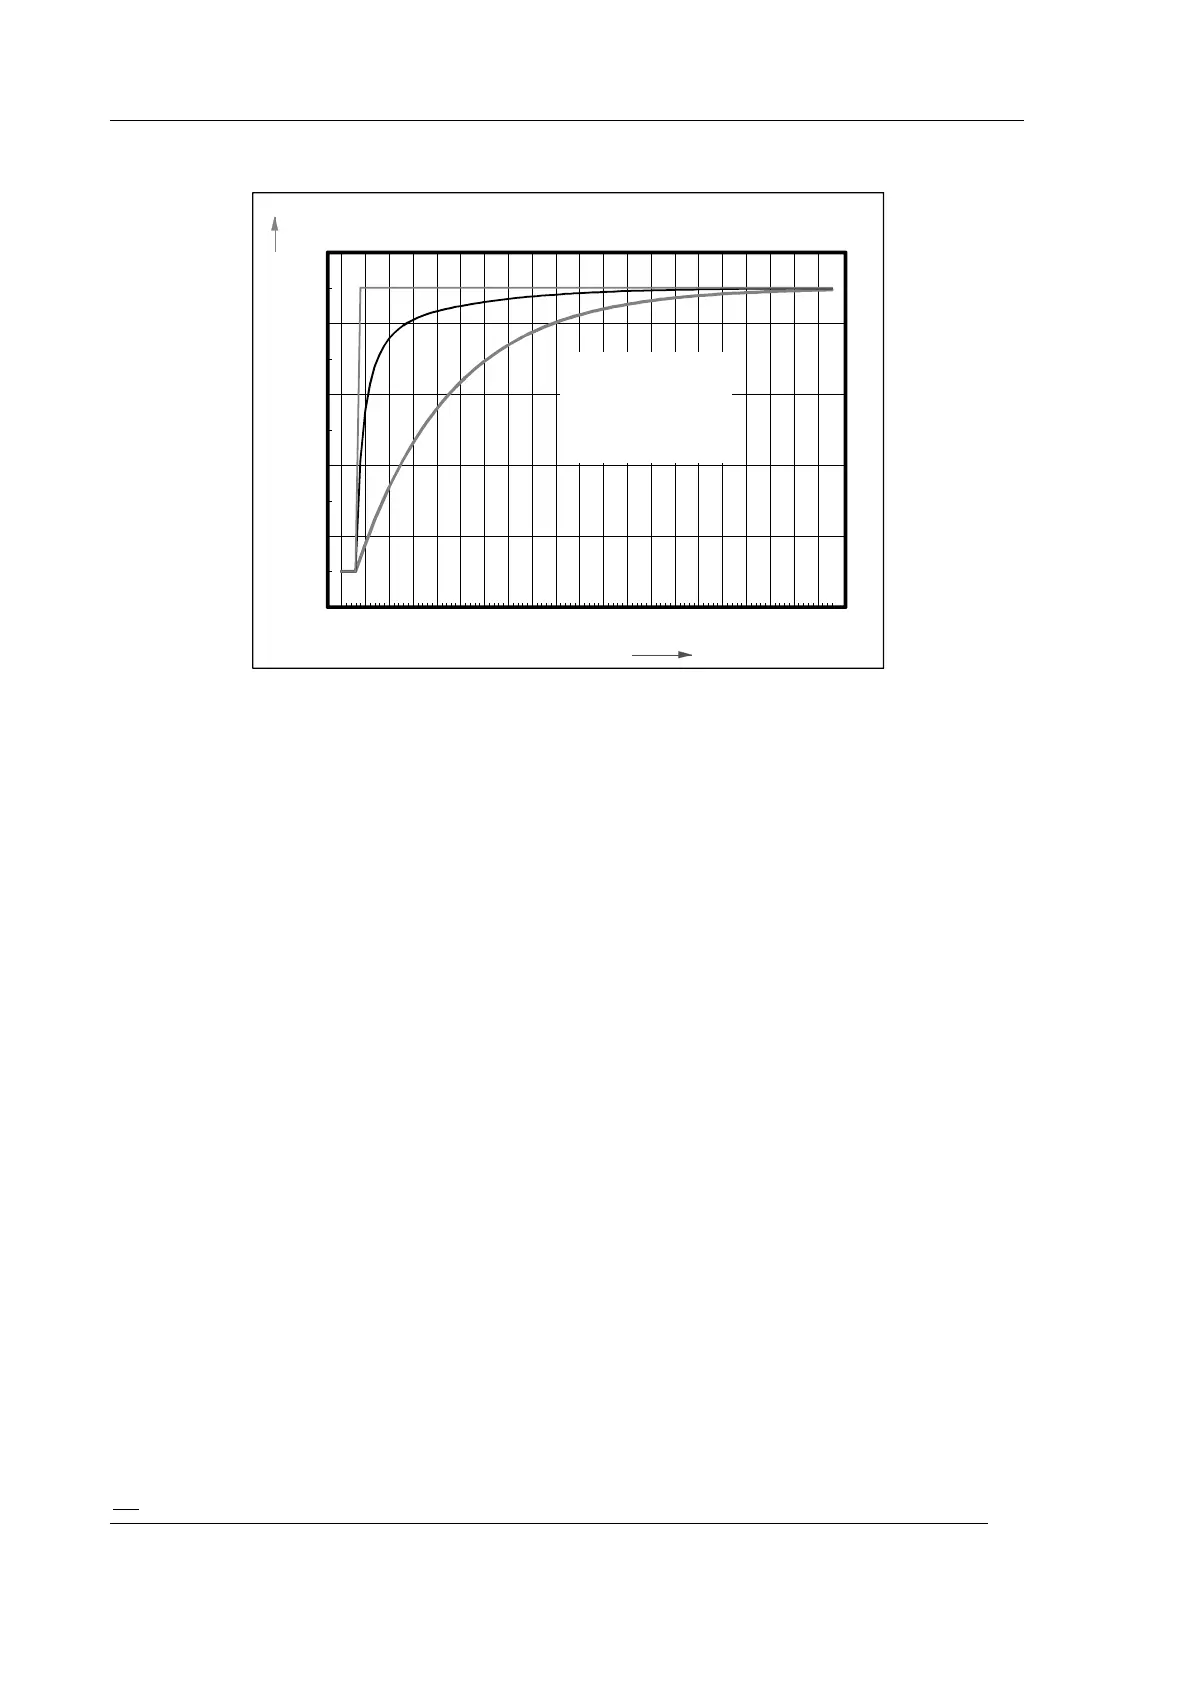
Display and output signal in %
1 Density value
2 Signal trend with
3 Signal trend without
automatic switchover
of time constant
Figure 13: Response
When rapid switchover is in effect, the measurement first works with the defined basic
time constant. If sudden concentration changes occur which exceed the Sigma band, the
system switches to 1/10 of the time constant and reading and output signal can follow
the concentration change much quicker. At the same time, statistical variations increase
by a factor of about 3. When the concentration value becomes stable again, the system
automatically switches back to the longer basic time constant after a time period that
corresponds to the basic time constant.
7.6 Batch Measurement
If the measurement is carried out on or in a container which is filled and emptied
cyclically, the measurement can be carried out in the batch mode.
With the continuous measurement, the measured value at empty container is 0% K2O.
After the container has been filled, it takes a very long time until the new measured
value is reached again.
In the batch mode the measurement can be started when the container has been filled.
The earlier available measured value is deleted and the measurement is started new.
Thus, the new measured value is available in a much shorter time.
The batch mode is selected via the menu item
“Measure mode” “Batch mode”.
Variable measuring time:
Enter “0” as time constant.
The measurement is started in the batch mode by pushing the <run> button and
stopped by pushing the Sample <run> button again
or
by connecting the terminals 26a and 26c.
Fixed measuring time:
Enter a value > 2 as time constant.
 Loading...