Chapter 6 Statistics
Evia HF / HF-T Technical Manual
PAGE 69
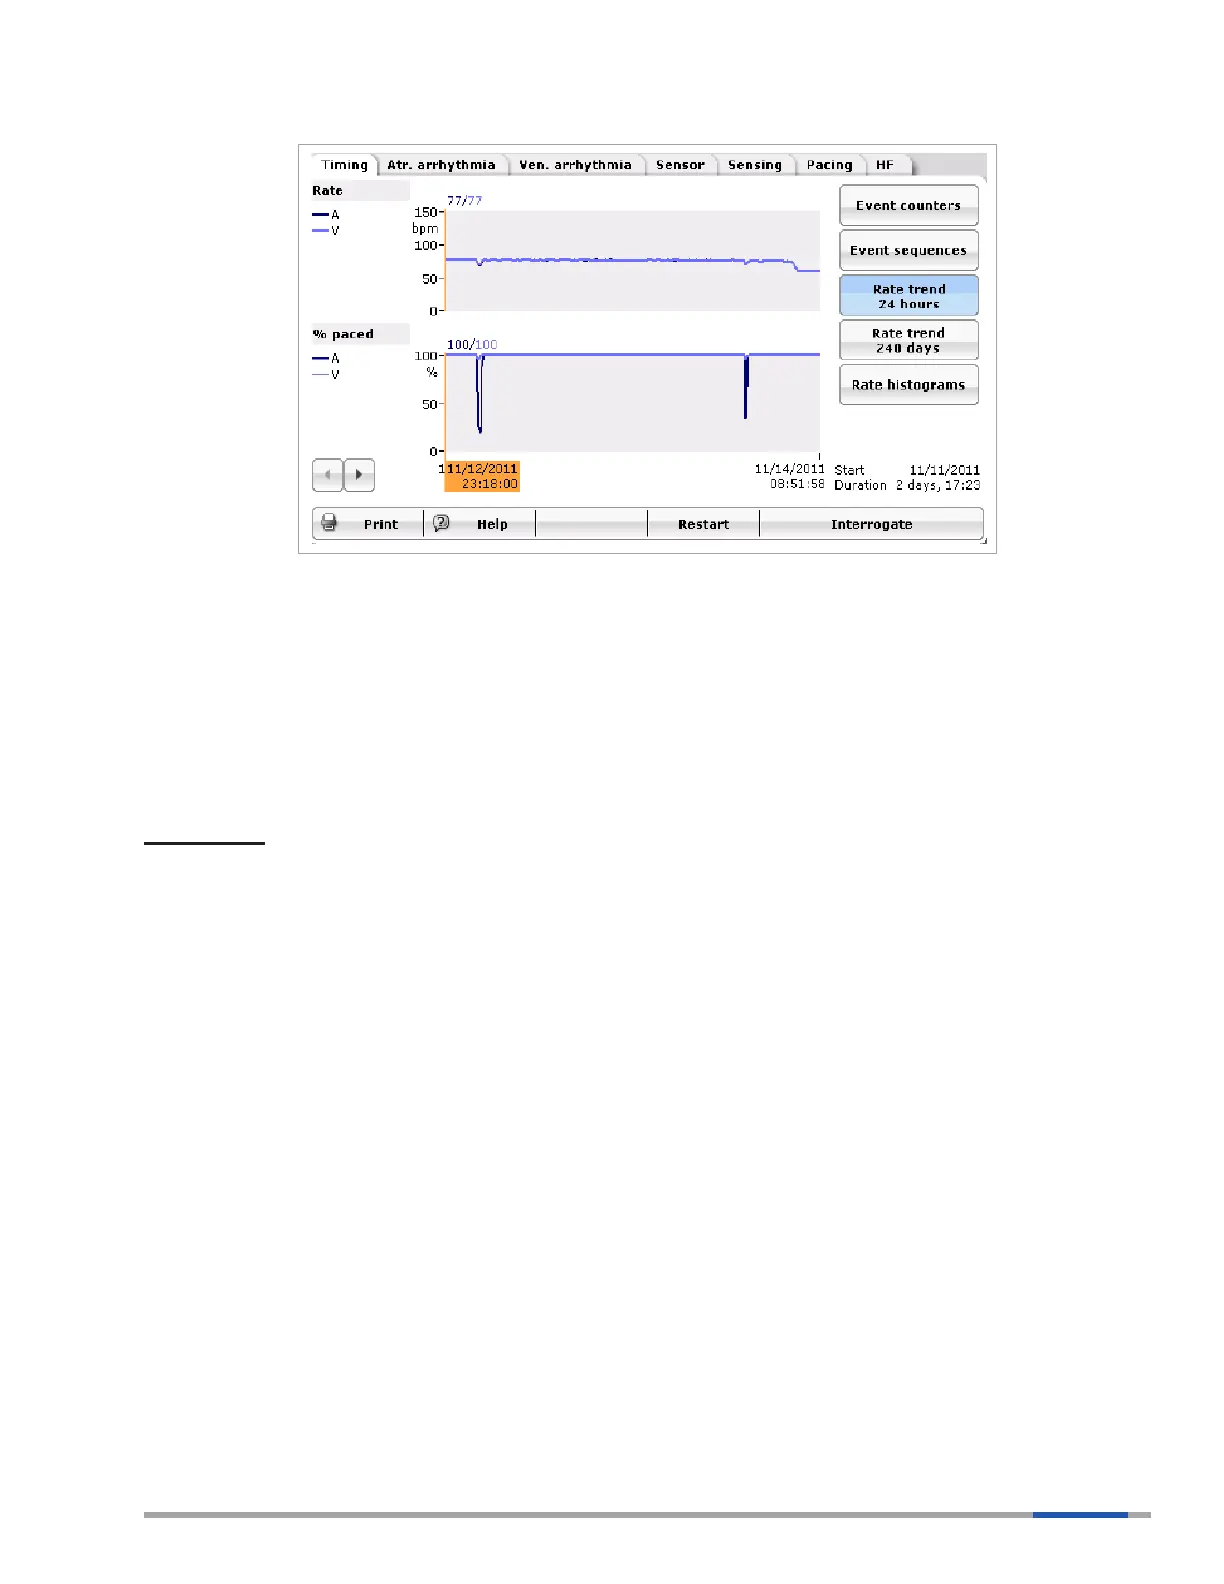
Figure 37: Rate Trend 24 Hours
The Rate Trend 24 hour statistic, shown in Figure 37, counts the number of paced and sensed events and
displays the information as a single data point in two different groups (heart rate and paced percentage).
Data are collected every 11 minutes and displayed on this graph. The heart rate and pacing
percentage are collected and displayed for each recording period. The graph is rolling, keeping only
the most current data.
Ars (FFP) and Vrs events are not counted in the Rate Trend.
Key Points:
The 24 hour rate trend provides a time-based prole of atrial and ventricular rates, plotted separately
for up to 24 hours prior to follow-up.
The rate trend is based upon As, Ap, Ars, As(PVARP) Vs, Vp, PVC, and Vrs.
The paced display shows the percentage of paced events in each chamber over the 24 hours prior to
follow-up.
Divergence of the atrial line and ventricular line indicates a loss of AV synchrony, which could be due to:
• Mode Switching
• PVCs
• Upper Rate Behavior (Wenckebach, 2:1)
• Far-field Sensing