9.3.2.5 YT diagram
The YT diagram is also known from the Gen1 data displays. With this widget you can display the
history of a sensor value over time. Ideal for a direct overview of the peaks of your sensor readings
after a pull.
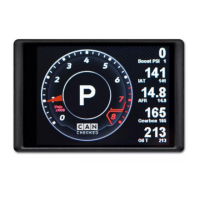
Figure 35: Display view of a YT diagramwith four graphs
The chart can be varied both in size and position. Only one sensor can be assigned to each diagram. If
several sensors are to be displayed simultaneously in one window, several YT diagram widgets must
be superimposed.
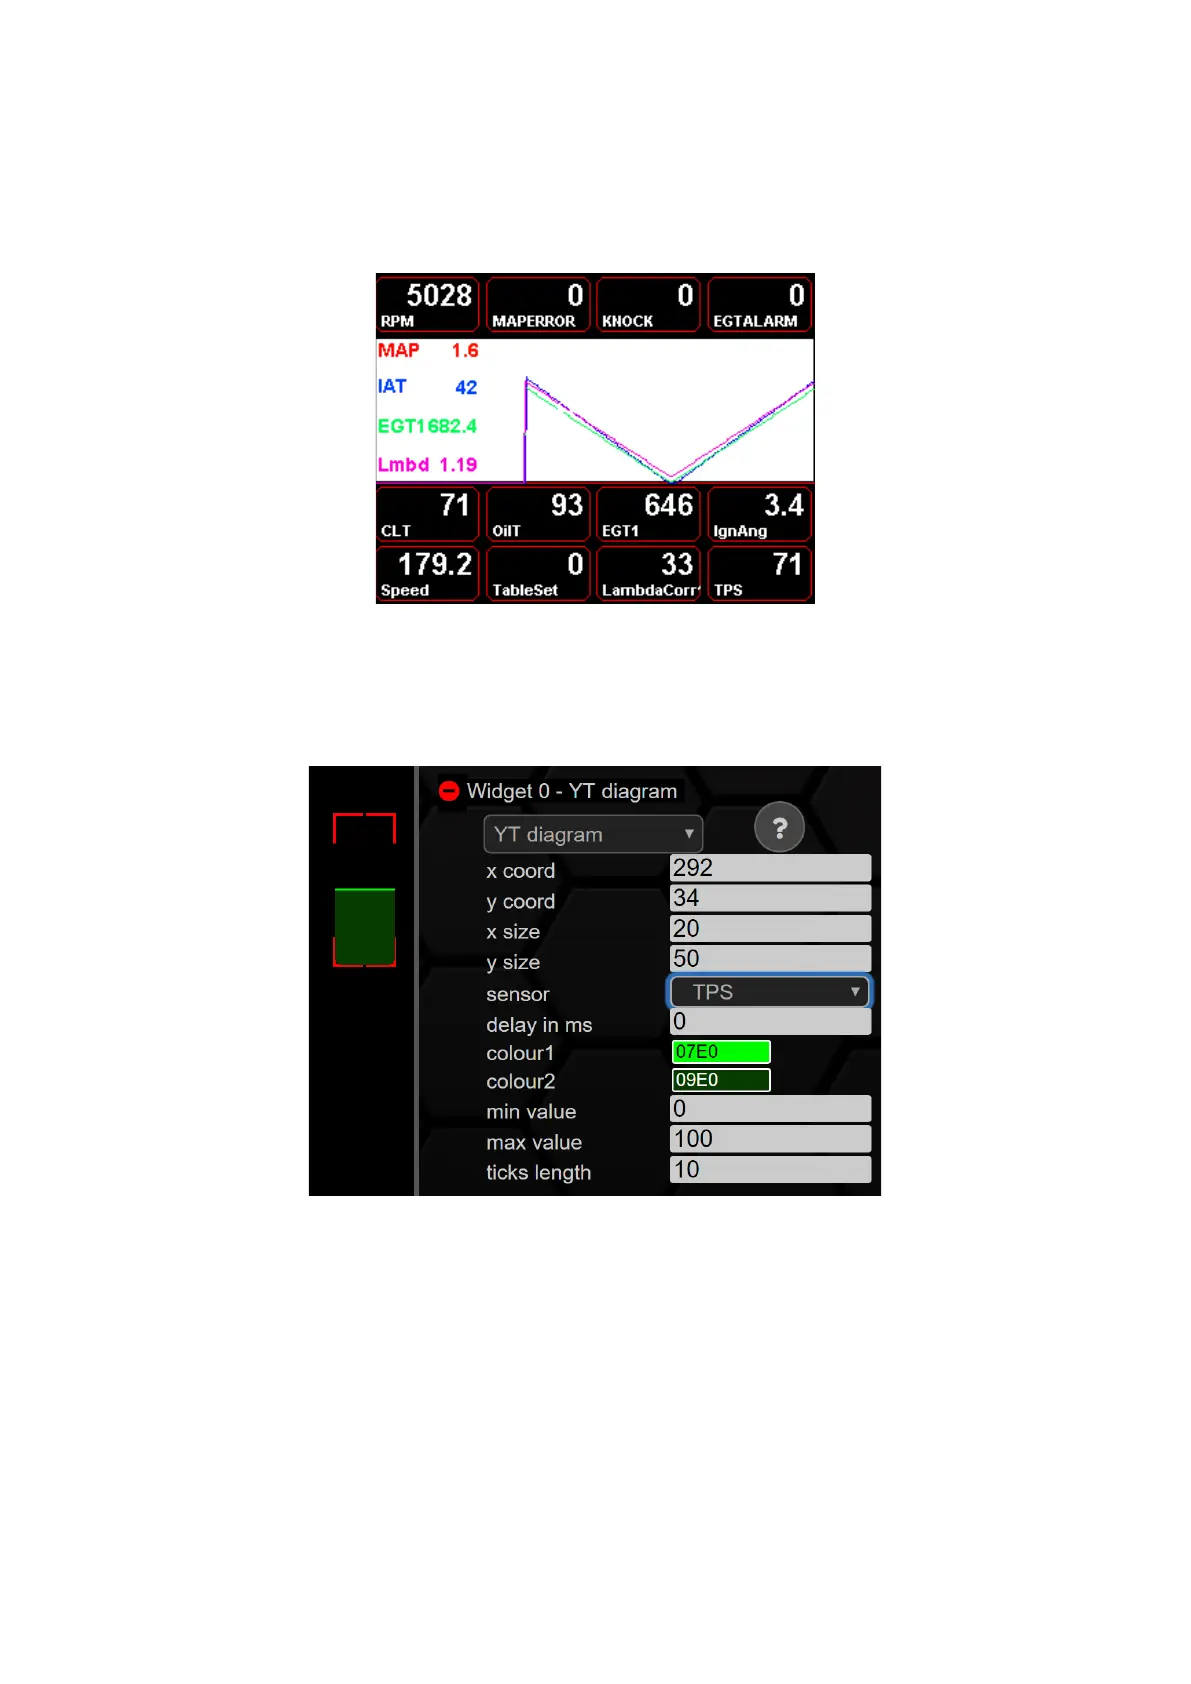
Figure 36: Configuration YT diagram
A delay can be implemented (delay in milliseconds). Furthermore, the color of the graph and the
underlying surface can be configured. If the two colors are identical, the underlying surface becomes
transparent. Min value and max value specify the lower and upper bounds of the y-axis,
respectively. With ticks length you can set a small mark every X pixel to better divide the X-axis.