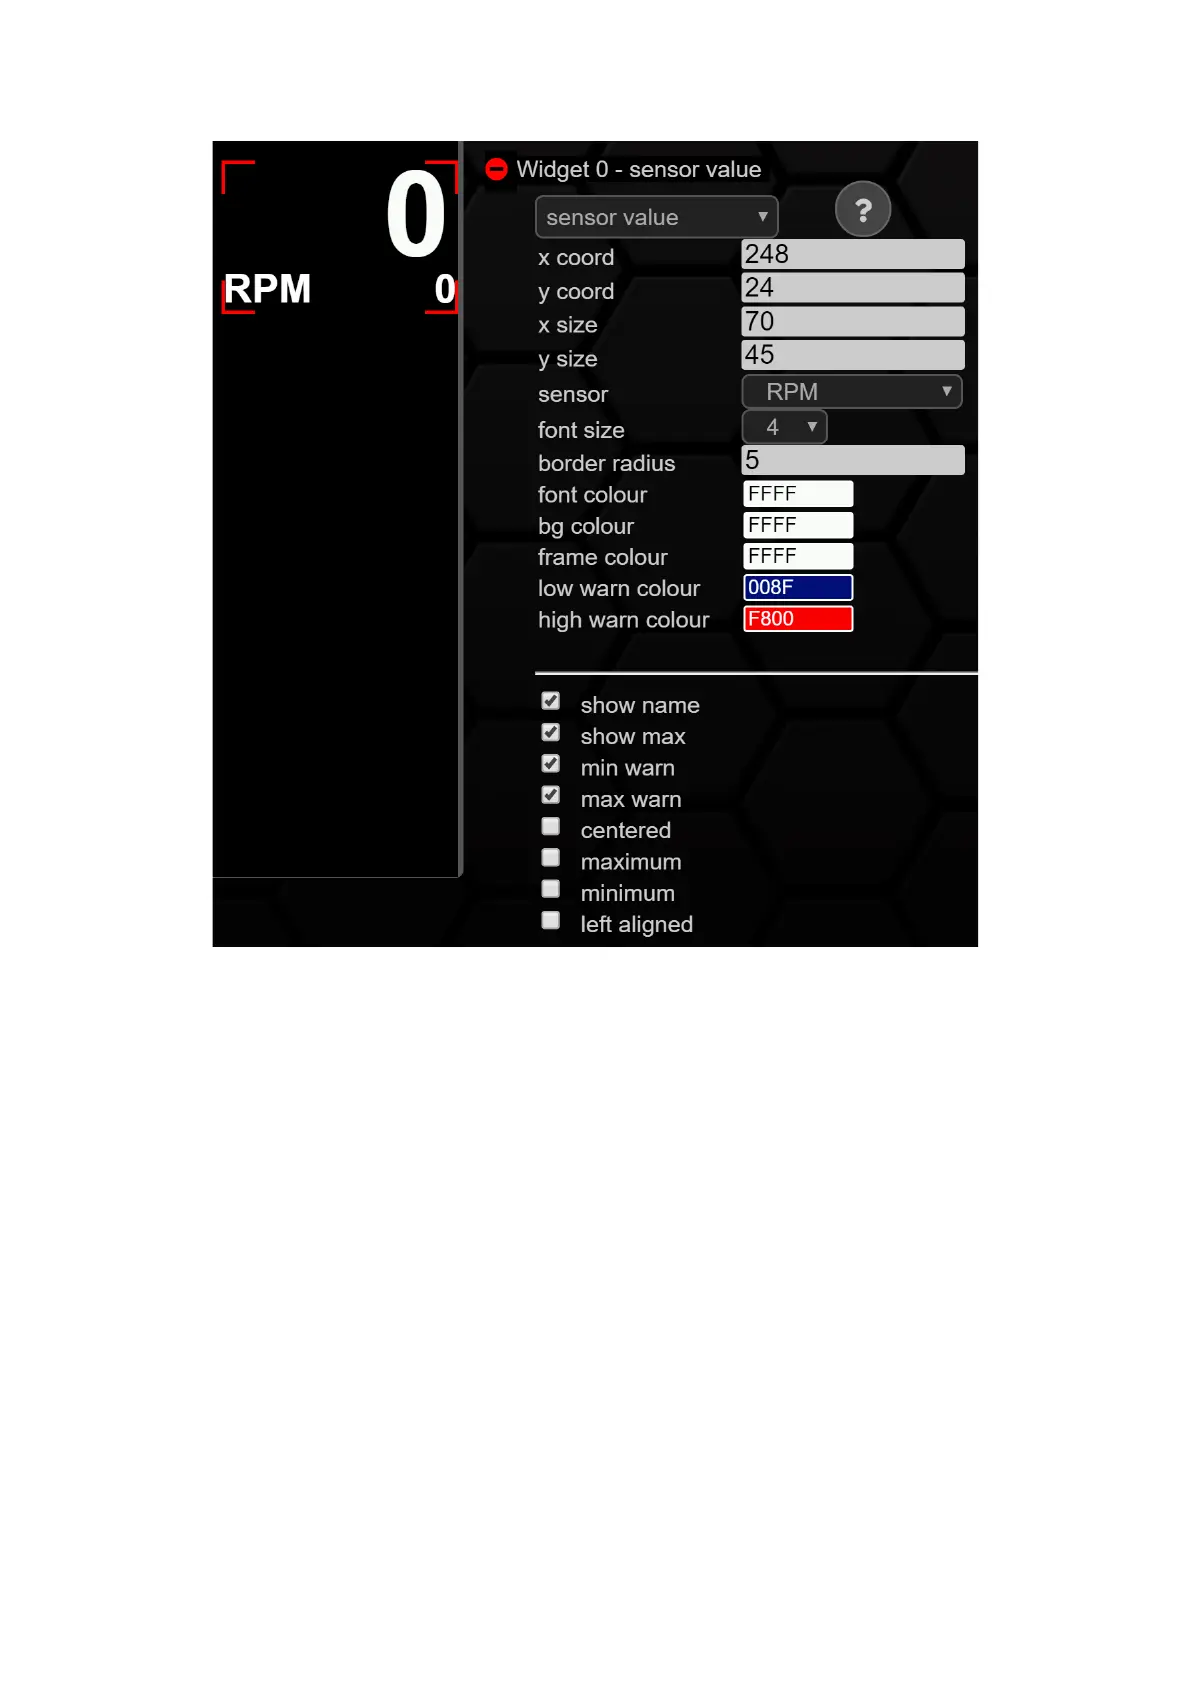
Figure 42: Configuration sensor value
By setting/removing the checkmarks, you can personalize your widget even further.
• show name -> shows the name of the associated sensor
• show max -> displays the maximum value of the current session as a small
numerical value below the measured value one
• m in warn -> activates the color set at low warn colour when falling below the
min value in the TRI/TRX file
• max warn -> activates the color set at high warn colour when the max value is
exceeded in the TRI/TRX file
• centered -> centers the measured value within the frames (x/y size)
• maximum -> hides the current measured value and displays the maximum value
of the current session
• minimum > hides the current measurement value and displays the minimum
value of the current session
• left alligned -> moves the measured value within the frame lines to the
left (x/y size)