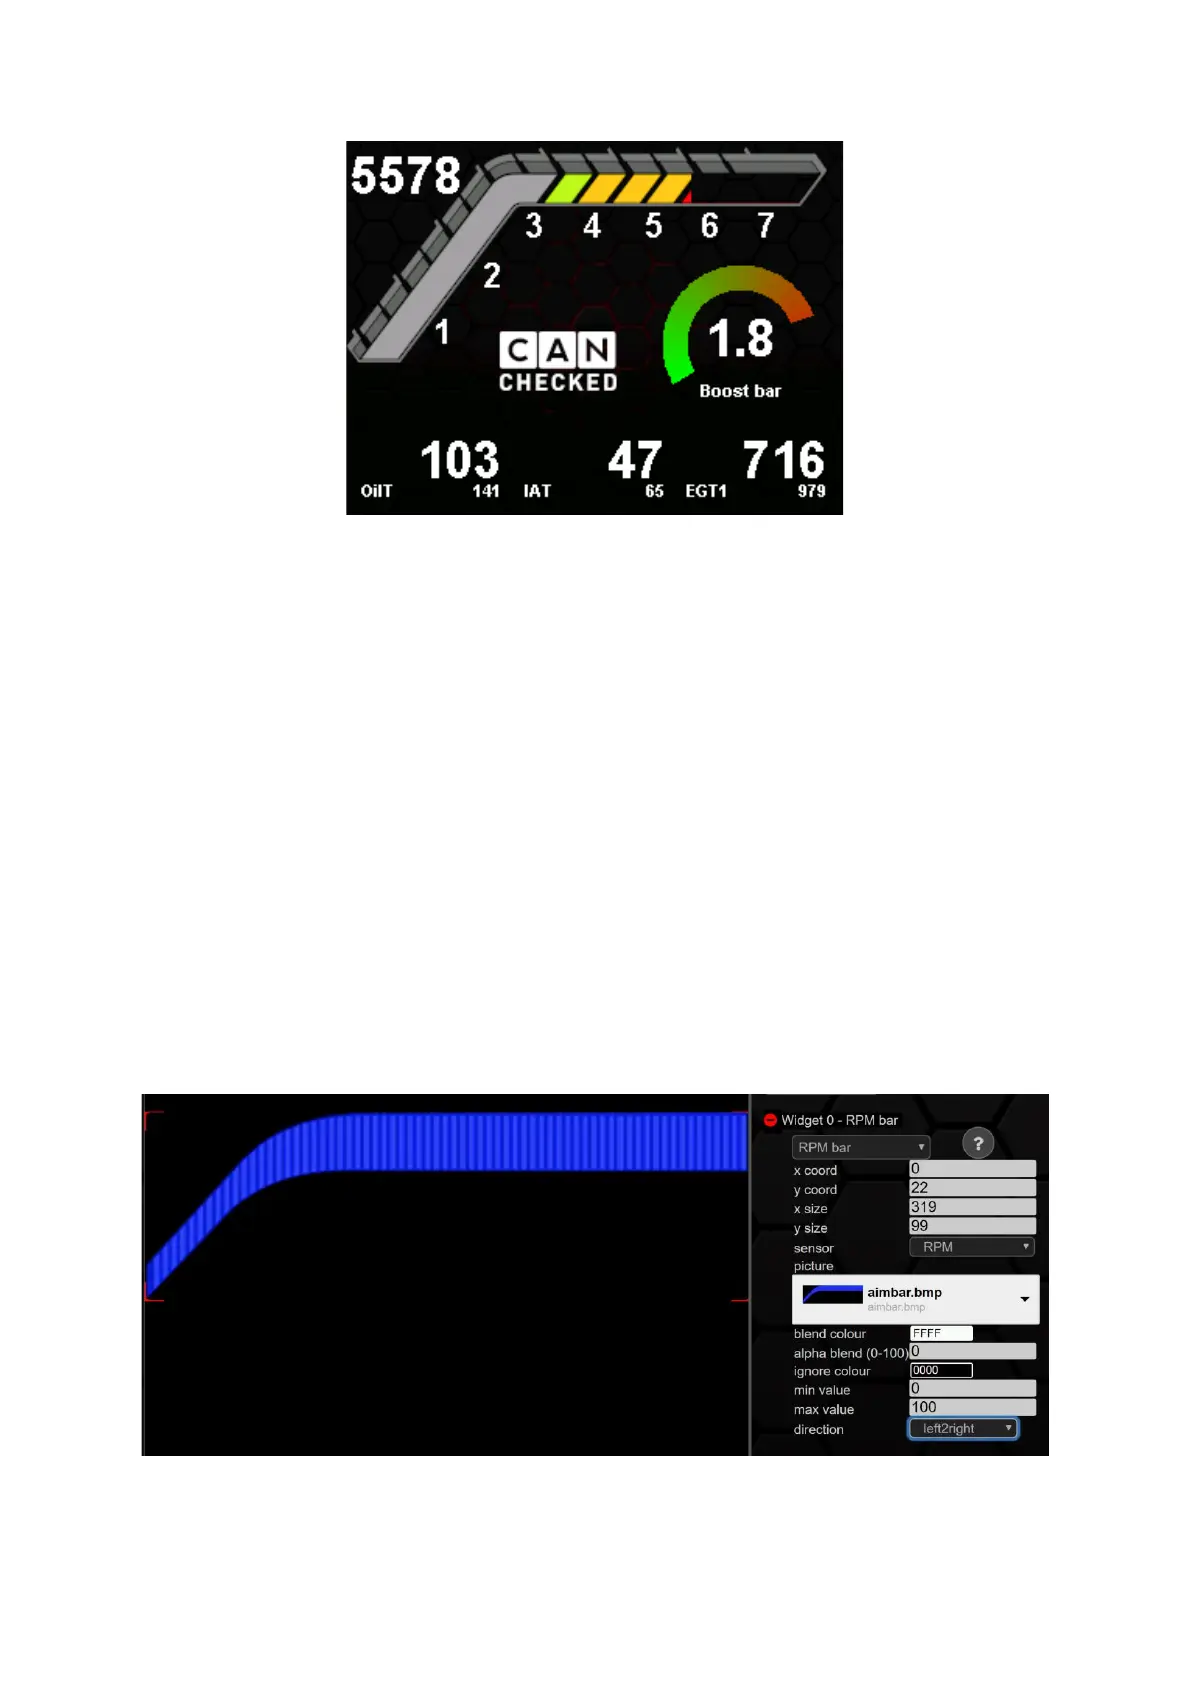
Figure 66: RPM bar as predefinded page
For example, an oil pressure indicator in digifiz style would also be conceivable. As with our other
widgets, there are no limits to your creativity, and you can make the CANchecked data display your
data display.
You can calibrate the RPM bar in position (x/y coord) and size (x/y size). In principle, this widget does
nothing more than gradually fade in and out an image depending on a sensor. As with the picture
widget, the colours of the image can be mixed or cropped using blend colour, alpha blend and ignore
colour.
min value defines the lower threshold value for starting an overlay, and max value defines the value
at which the image is fully displayed. Furthermore, the direction of the overlay can be defined:
• from left to right
• from right to left
• from bottom to top
• from top to bottom
Various predefined speed bars are possible. Due to the new design, however, specially designed
speed bars can also be uploaded and used. For uploading and scaling, see Chapter 9.6
Figure 67: Configuration RPM bar