Chapter 8: Geometry Application 160
u To draw a function
1. Tap [Draw] - [Function] - [ f ( x)].
• Or you could tap { on the tool bar. Next on
the Function dialog box that appears, use
the Type box to select “
f ( x)”.
2. On the Function dialog box, input the
function and then tap [OK] to draw it.
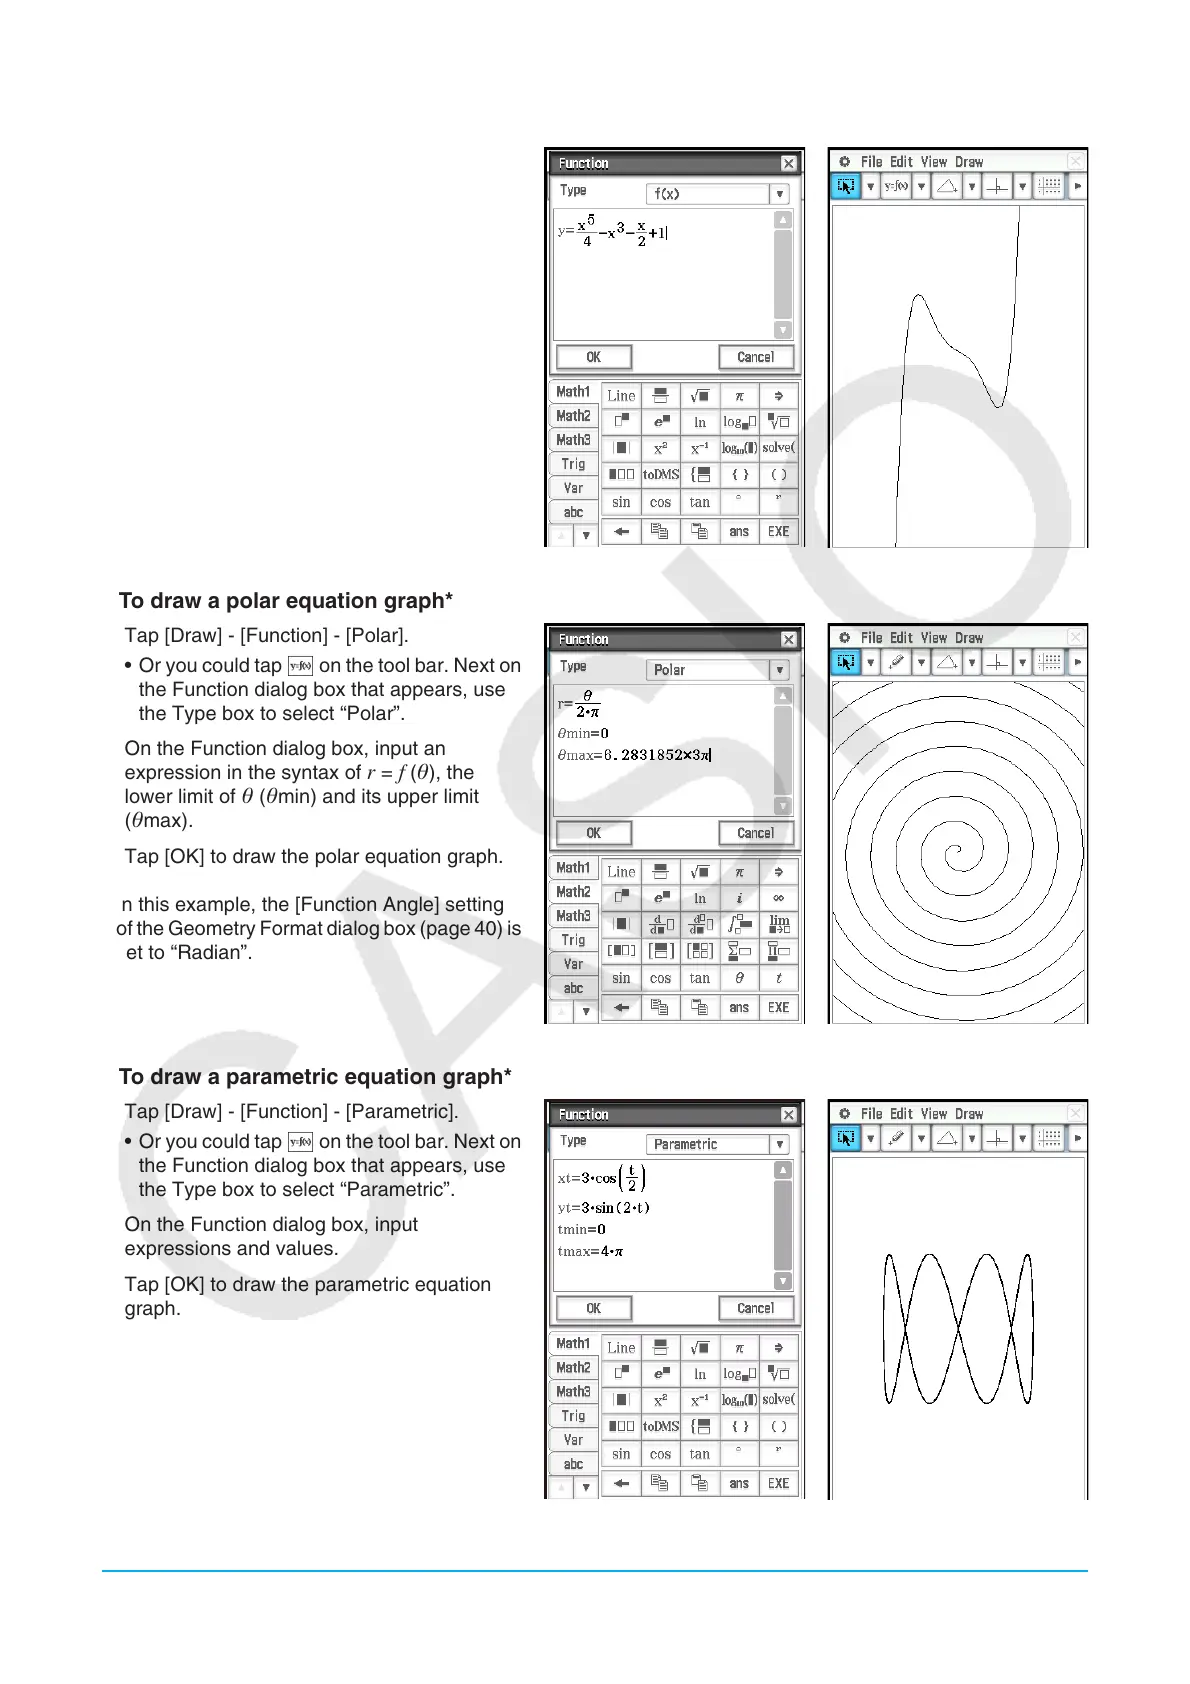
u To draw a polar equation graph*
1. Tap [Draw] - [Function] - [Polar].
• Or you could tap { on the tool bar. Next on
the Function dialog box that appears, use
the Type box to select “Polar”.
2. On the Function dialog box, input an
expression in the syntax of
r = f (), the
lower limit of (min) and its upper limit
(max).
3. Tap [OK] to draw the polar equation graph.
* In this example, the [Function Angle] setting
of the Geometry Format dialog box (page 40) is
set to “Radian”.
u To draw a parametric equation graph*
1. Tap [Draw] - [Function] - [Parametric].
• Or you could tap { on the tool bar. Next on
the Function dialog box that appears, use
the Type box to select “Parametric”.
2. On the Function dialog box, input
expressions and values.
3. Tap [OK] to draw the parametric equation
graph.
* In this example, the [Function Angle] setting
of the Geometry Format dialog box (page 40) is
set to “Radian”.

 Loading...


