Chapter 15: Picture Plot Application 266
u To display plots on t-y coordinates or t-x coordinates
To display plots on t-y coordinates, tap [Graph] - [Transform Axes] - [t-y] or tap v.
To display plots on
t-x coordinates, tap [Graph] - [Transform Axes] - [t-x] or tap c.
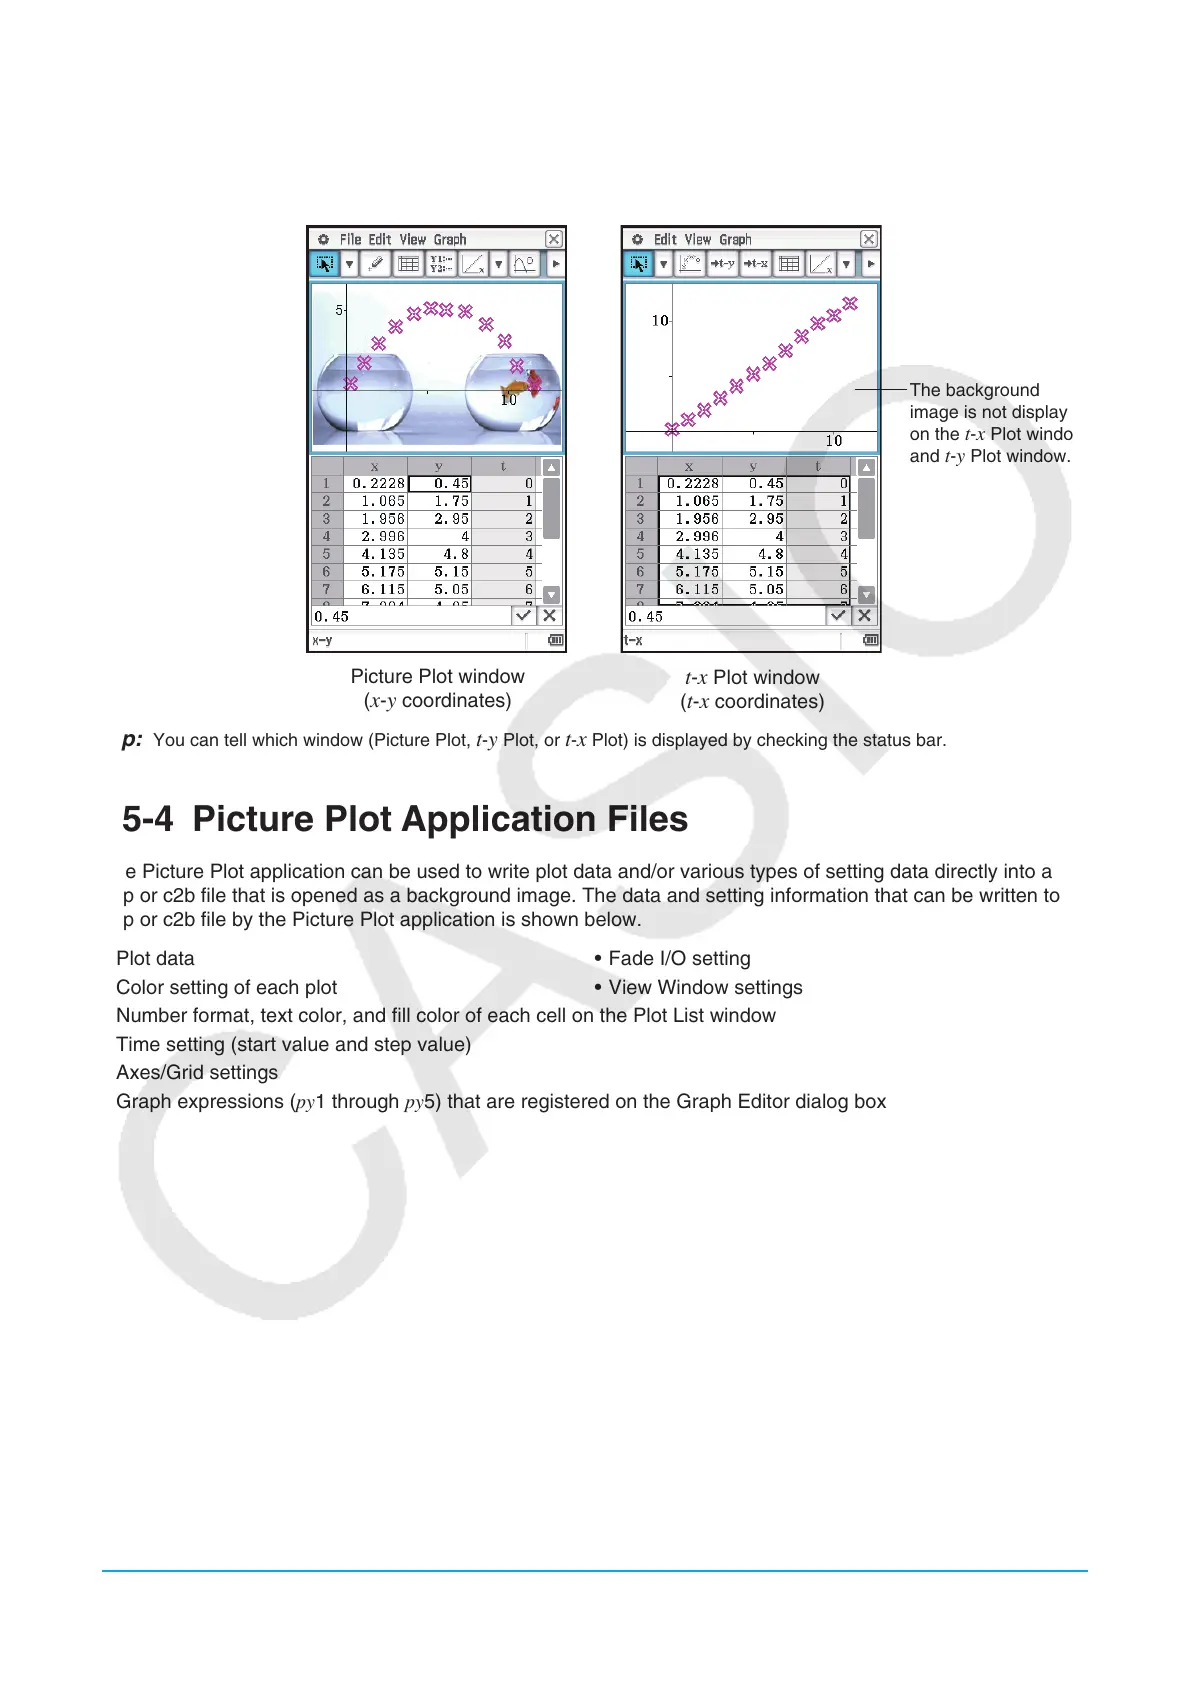
The background
image is not displayed
on the
t-x Plot window
and
t-y Plot window.
Picture Plot window
(x-y coordinates)
t-x Plot window
(t-x coordinates)
Tip: You can tell which window (Picture Plot, t-y Plot, or t-x Plot) is displayed by checking the status bar.
15-4 Picture Plot Application Files
The Picture Plot application can be used to write plot data and/or various types of setting data directly into a
c2p or c2b file that is opened as a background image. The data and setting information that can be written to a
c2p or c2b file by the Picture Plot application is shown below.
• Plot data • Fade I/O setting
• Color setting of each plot • View Window settings
• Number format, text color, and fill color of each cell on the Plot List window
• Time setting (start value and step value)
• Axes/Grid settings
• Graph expressions (py1 through py5) that are registered on the Graph Editor dialog box

 Loading...


