Chapter 13: Spreadsheet Application 248
Two-Way ANOVA
When (Factor A count) × (Factor B count) = m, prepare test data that is n rows ×
m columns. For example, when there are Factor A items and one Factor B
items, input six columns of data into the spreadsheet. For example, select
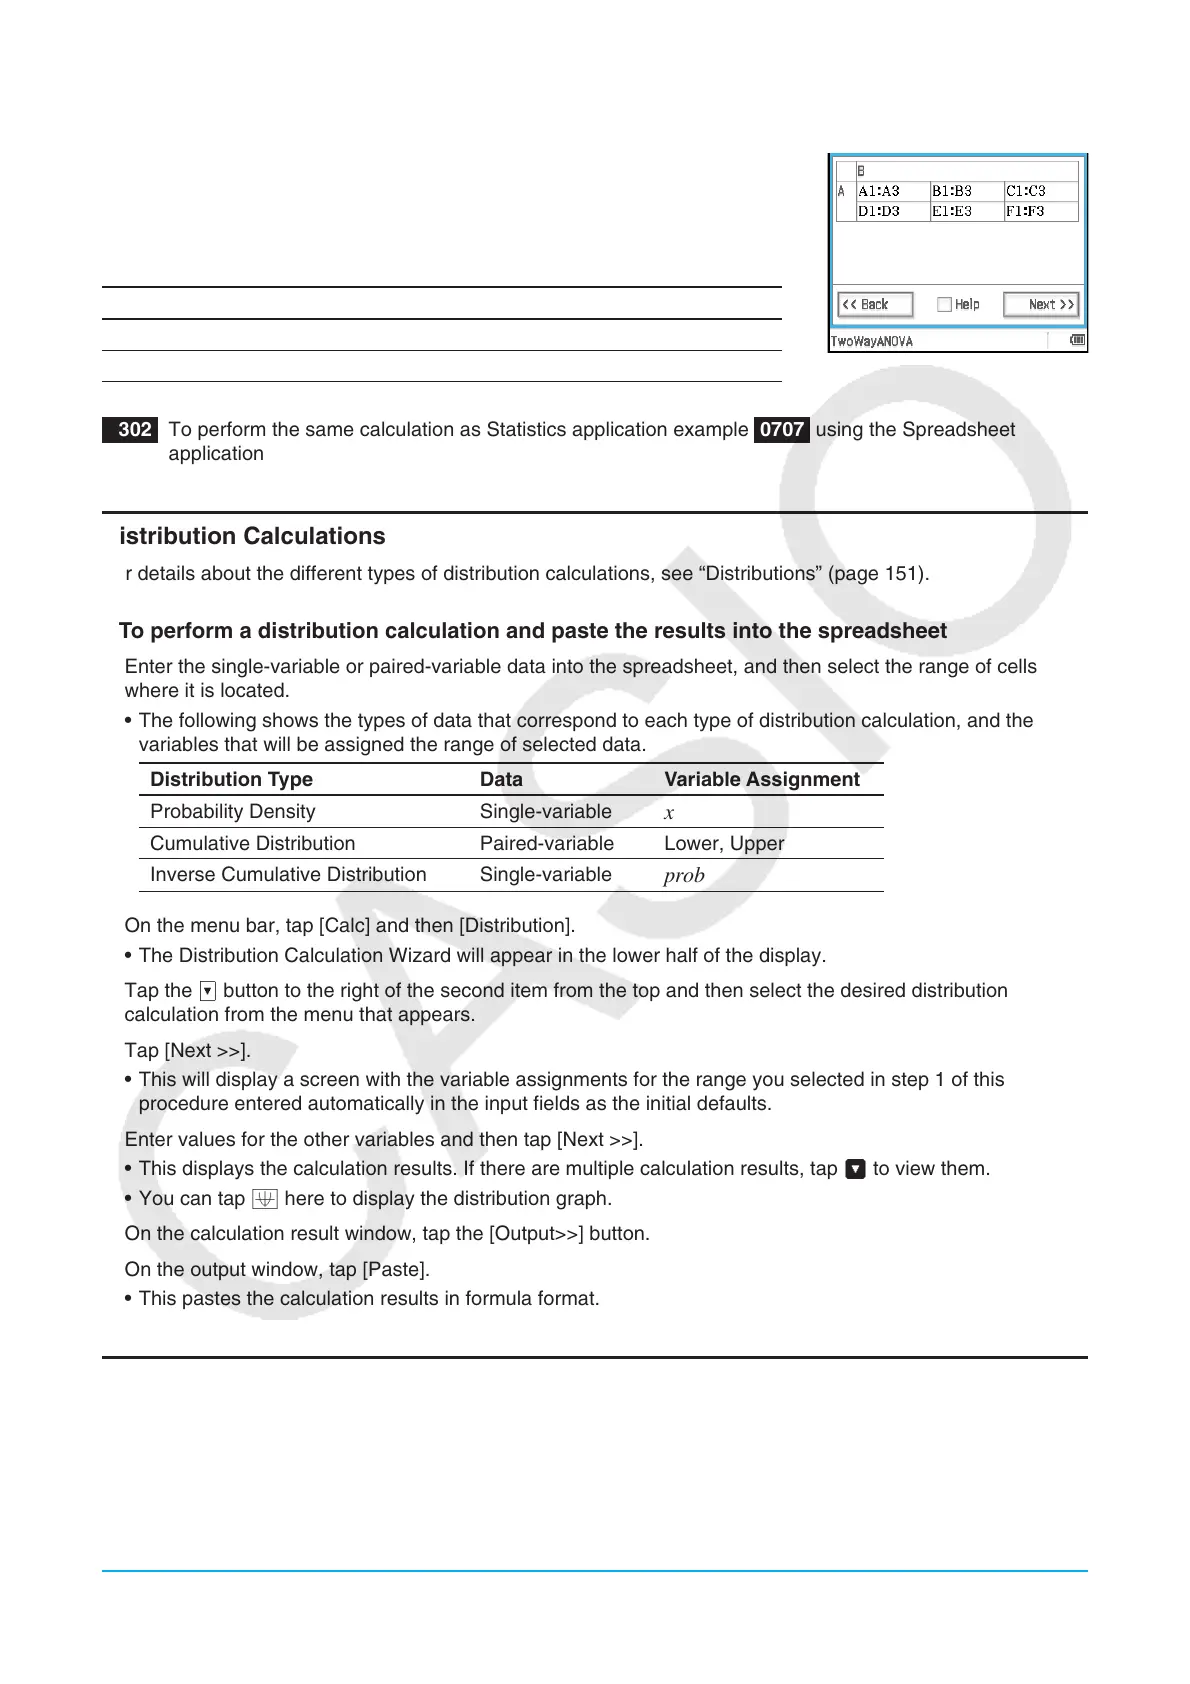
A1:F3 on the spreadsheet and run the wizard. This will automatically assign
the cell references shown below to each factor.
Factor B1 Factor B2 Factor B3
Factor A1 A1:A3 B1:B3 C1:C3
Factor A2 D1:D3 E1:E3 F1:F3
1302 To perform the same calculation as Statistics application example 0707 using the Spreadsheet
application
Distribution Calculations
For details about the different types of distribution calculations, see “Distributions” (page 151).
u To perform a distribution calculation and paste the results into the spreadsheet
1. Enter the single-variable or paired-variable data into the spreadsheet, and then select the range of cells
where it is located.
• The following shows the types of data that correspond to each type of distribution calculation, and the
variables that will be assigned the range of selected data.
Distribution Type Data Variable Assignment
Probability Density Single-variable
x
Cumulative Distribution Paired-variable Lower, Upper
Inverse Cumulative Distribution Single-variable
prob
2. On the menu bar, tap [Calc] and then [Distribution].
• The Distribution Calculation Wizard will appear in the lower half of the display.
3. Tap the v button to the right of the second item from the top and then select the desired distribution
calculation from the menu that appears.
4. Tap [Next >>].
• This will display a screen with the variable assignments for the range you selected in step 1 of this
procedure entered automatically in the input fields as the initial defaults.
5. Enter values for the other variables and then tap [Next >>].
• This displays the calculation results. If there are multiple calculation results, tap V to view them.
• You can tap $ here to display the distribution graph.
6. On the calculation result window, tap the [Output>>] button.
7. On the output window, tap [Paste].
• This pastes the calculation results in formula format.
About DispStat Command
Tapping [Calc] - [DispStat] displays a DispStat window that displays statistical calculation (one-variable, two-
variable, regression, test, interval, distribution, or inverse distribution calculations) results after a calculation is
performed.