Chapter 15: Picture Plot Application 258
Picture Plot Application-Specific Menus and Buttons
Picture Plot window
• Open the c2p or c2b file ................................................................................................................. File - Open
• Save the c2p or c2b file being edited ..............................................................................................File - Save
• Adjust the lightness of an image (page 259) .............................................................................File - Fade I/O
• When the currently open image is a c2b file, sequentially display the image in the file ...................File - Play
• Display a color setting dialog box for the currently selected plot ................................................... Edit - Style
• Start editing of plots in the c2b file ........................................................................Edit - Edit Plot (Animation)
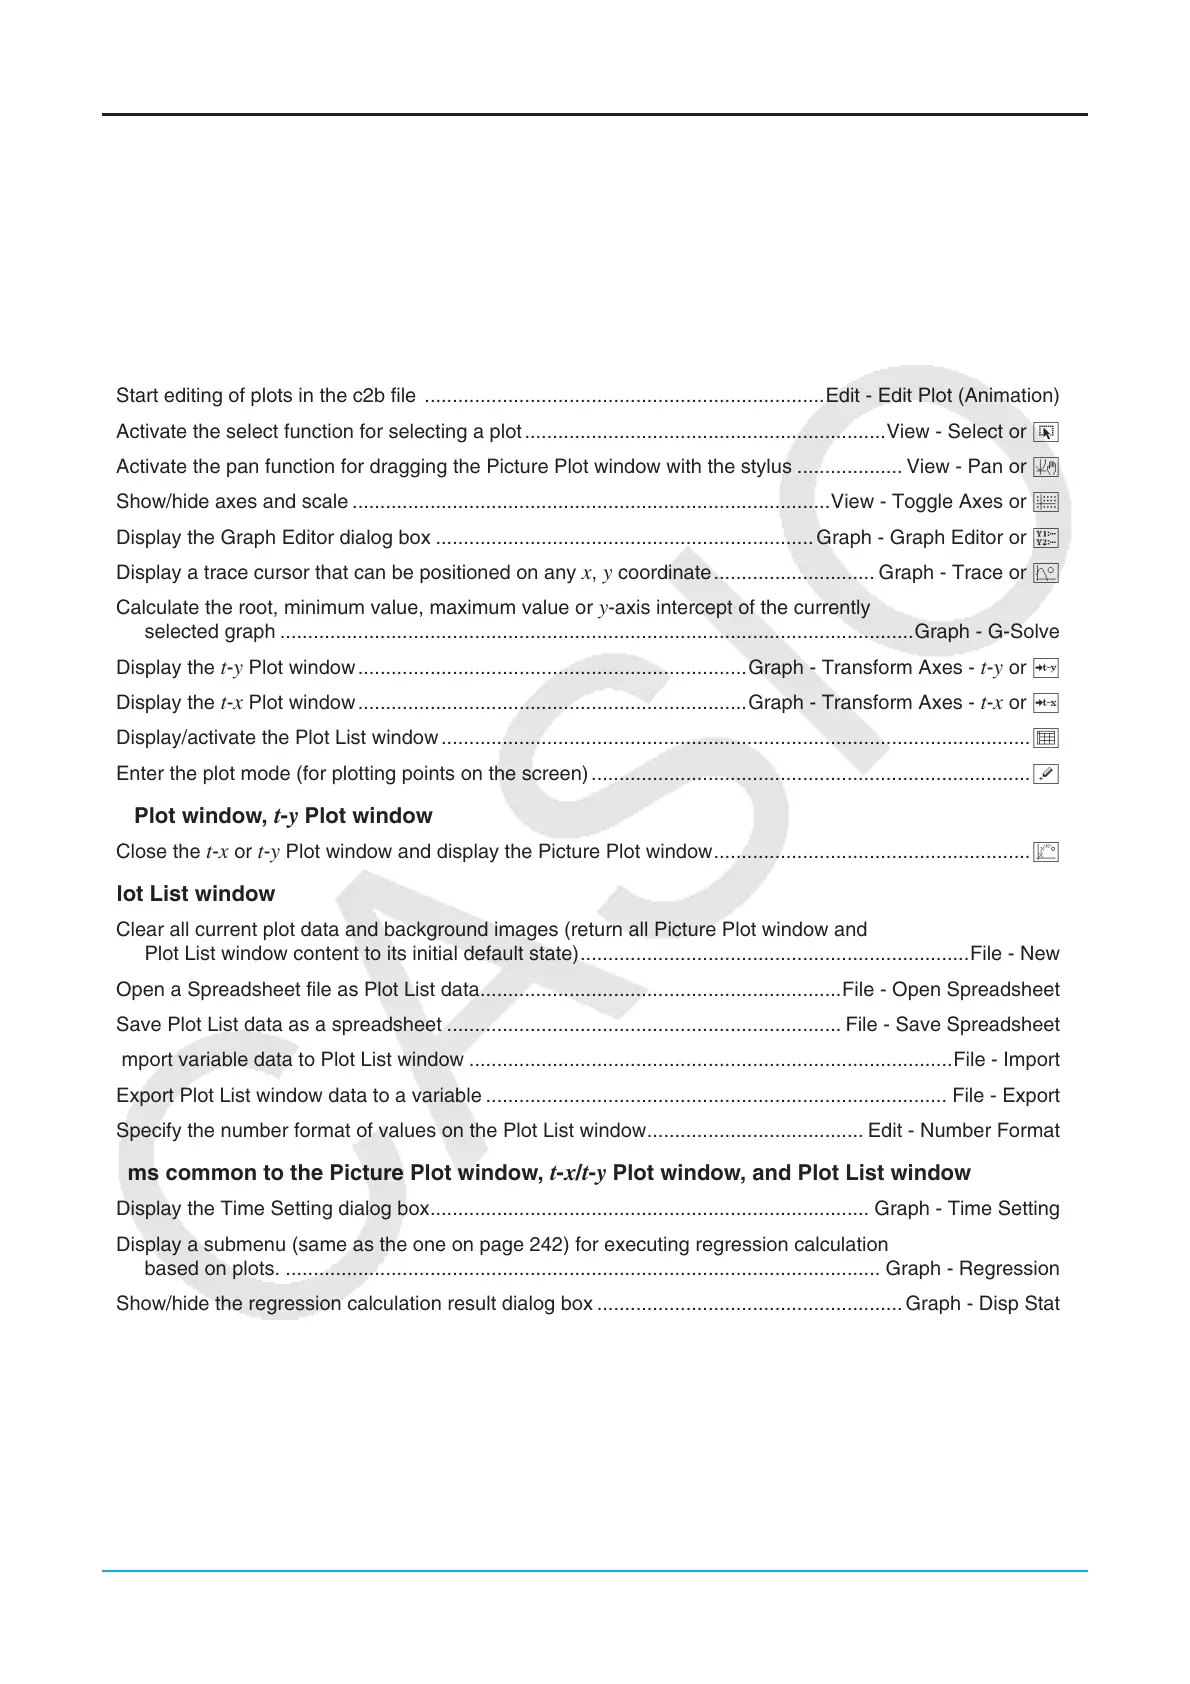
• Activate the select function for selecting a plot .................................................................View - Select or G
• Activate the pan function for dragging the Picture Plot window with the stylus ................... View - Pan or T
• Show/hide axes and scale ......................................................................................View - Toggle Axes or q
• Display the Graph Editor dialog box .................................................................... Graph - Graph Editor or !
• Display a trace cursor that can be positioned on any
x, y coordinate ............................. Graph - Trace or K
• Calculate the root, minimum value, maximum value or
y-axis intercept of the currently
selected graph ..................................................................................................................Graph - G-Solve
• Display the
t-y Plot window ......................................................................Graph - Transform Axes - t-y or v
• Display the t-x Plot window ......................................................................Graph - Transform Axes - t-x or c
• Display/activate the Plot List window ..........................................................................................................Q
• Enter the plot mode (for plotting points on the screen) ...............................................................................[
t-x Plot window, t-y Plot window
• Close the t-x or t-y Plot window and display the Picture Plot window .........................................................5
Plot List window
• Clear all current plot data and background images (return all Picture Plot window and
Plot List window content to its initial default state) ......................................................................File - New
• Open a Spreadsheet file as Plot List data .................................................................File - Open Spreadsheet
• Save Plot List data as a spreadsheet ....................................................................... File - Save Spreadsheet
• Import variable data to Plot List window .......................................................................................File - Import
• Export Plot List window data to a variable ................................................................................... File - Export
• Specify the number format of values on the Plot List window ....................................... Edit - Number Format
Items common to the Picture Plot window, t-x/t-y Plot window, and Plot List window
• Display the Time Setting dialog box ............................................................................... Graph - Time Setting
• Display a submenu (same as the one on page 242) for executing regression calculation
based on plots. ........................................................................................................... Graph - Regression
• Show/hide the regression calculation result dialog box ....................................................... Graph - Disp Stat

 Loading...

