Chapter 14: 3D Graph Application 253
14-2 Using the 3D Graph Window
This section explains 3D Graph window operations, including configuring display settings, changing the angle
of a graph, rotating a graph, and more.
Configuring 3D Graph View Window Parameters
Use the 3D Graph View Window to specify maximum and minimum values for the
x-axis, y-axis, z-axis, s-variable, and t-variable.
You can also specify the number of lines you would like for drawing the grid. For the
xgrid enter the number of lines you would like drawn within the interval from xmin to
xmax. For example, if xmin = −3, xmax = 3 and xgrid = 15, 15 almost vertical lines will
be used to display your graph. The ygrid lines will be almost horizontal.
u To configure View Window parameters
1. Tap 6, or tap O and then [View Window] to display the View Window dialog box.
2. Configure View Window parameters required for the type of graph you want to draw.
Use this item: To configure this View Window parameter: Initial default
xmin/ymin/zmin Minimum x-axis/y-axis/z-axis value
–3
xmax/ymax/zmax Maximum x-axis/y-axis/z-axis value
3
xgrid/ygrid Number of grid lines used for x-axis/y-axis direction
25
angle
Clockwise angle of x-axis
20
angle
Eye position relative to the plane created by the x-axis and
y-axis, and the angle of the z-axis
70
smin/tmin Minimum s-variable/t-variable value
–3.14159265358979
smax/tmax Maximum s-variable/t-variable value
3.14159265358979
3. After all the parameters are the way you want, tap [OK].
• When you tap [OK] after changing View Window dialog box settings, the graph is redrawn automatically
using the new View Window settings.
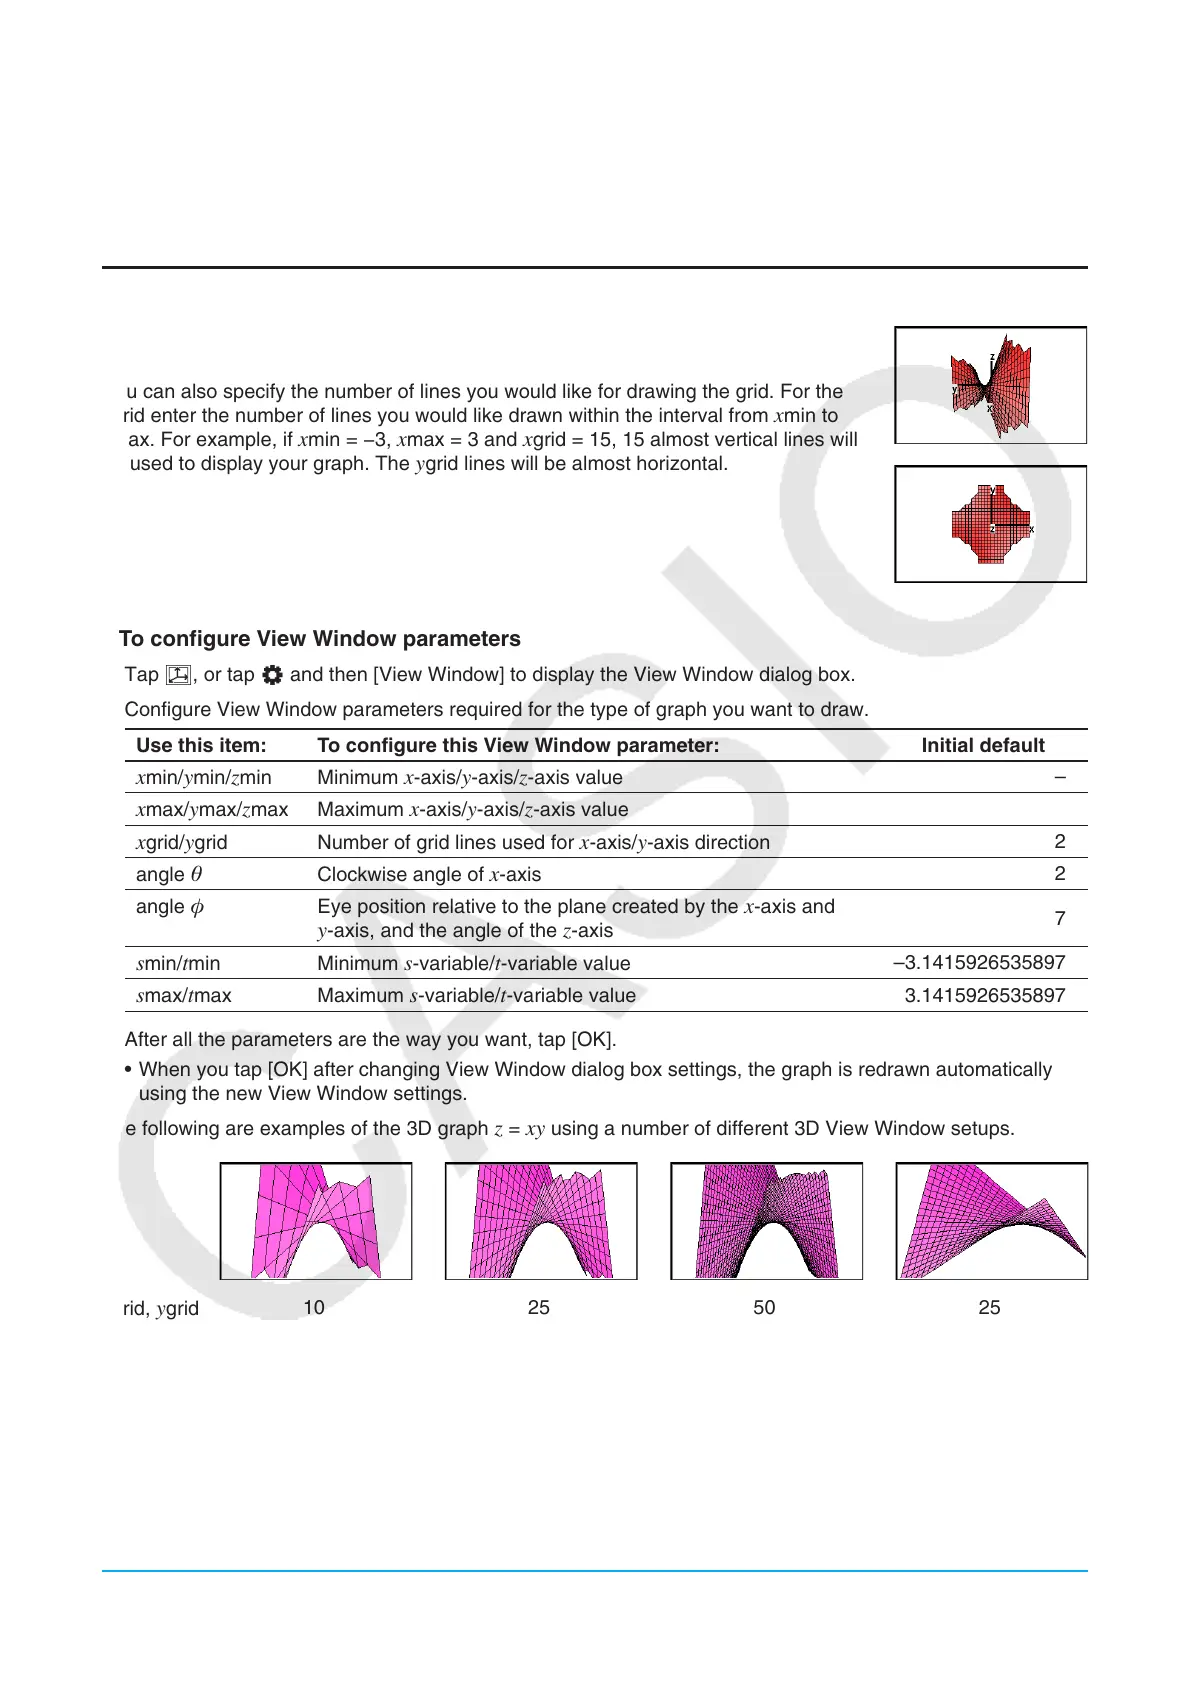
The following are examples of the 3D graph
z = xy using a number of different 3D View Window setups.
xgrid, ygrid
10 25 50 25
xmin, ymin
−3 −3 −3 −1.5
xmax, ymax
3 3 3 1.5
Important!
• As is evident from the above sample screenshots, the greater the xgrid and ygrid values, the more detailed
the graph. Also note, however, that larger values require more calculation, which means that the graphing
operation takes more time.
• Graphing may be impossible if the
xgrid and ygrid values are too small.