Chapter 15: Picture Plot Application 265
u To save plot coordinate data as a spreadsheet
1. On the Plot List window, tap [File] - [Save Spreadsheet].
2. On the dialog box that appears, specify the file save destination folder and input a file name.
3. Tap [Save].
u To import a spreadsheet as plot coordinate data
1. On the Plot List window, tap [File] - [Open Spreadsheet].
2. On the dialog box that appears, select the spreadsheet you want to import and then tap [Open].
Note: If the number of rows of spreadsheet you selected in step 2 of the above procedure exceeds the
allowable maximum (50 for a c2p file, equal to the number of still images for a c2b file), rows are
imported only up to the allowable maximum. Any spreadsheet data from Column C onwards and format
information that is not supported by the Plot List window is ignored.
Exporting Plot Data to and Importing Plot Data from a Variable
You can import LIST (list), MAT (matrix), and EXPR (expression) variables into the Plot List window. Data
inside of cells selected on the Plot List window can be exported as at LIST, MAT, or EXPR variable. The
steps of these operations are the same as those for the Spreadsheet application. For more information, see
“Importing and Exporting Variable Values” (page 235).
15-3 Displaying Plots on t-y or t-x Coordinates
As can be seen on the Plot List window, the data for each plot includes x- and y-coordinates, as well as a time
value t. On the Picture Plot screen each plot is normally displayed as coordinates (x, y) on an x-y plane, but
time value t can be used to display plots as coordinates (t, y) on a t-y plane or as coordinates (t, x) on a t-x
plane.
Under initial default settings, time values are 0, 1, 2, and so on (arithmetic progression with a start value of 0
and a step value of 1), in accordance with the sequence that the points are plotted. You can change the
t value
assigned to each plot by changing the start value and step value.
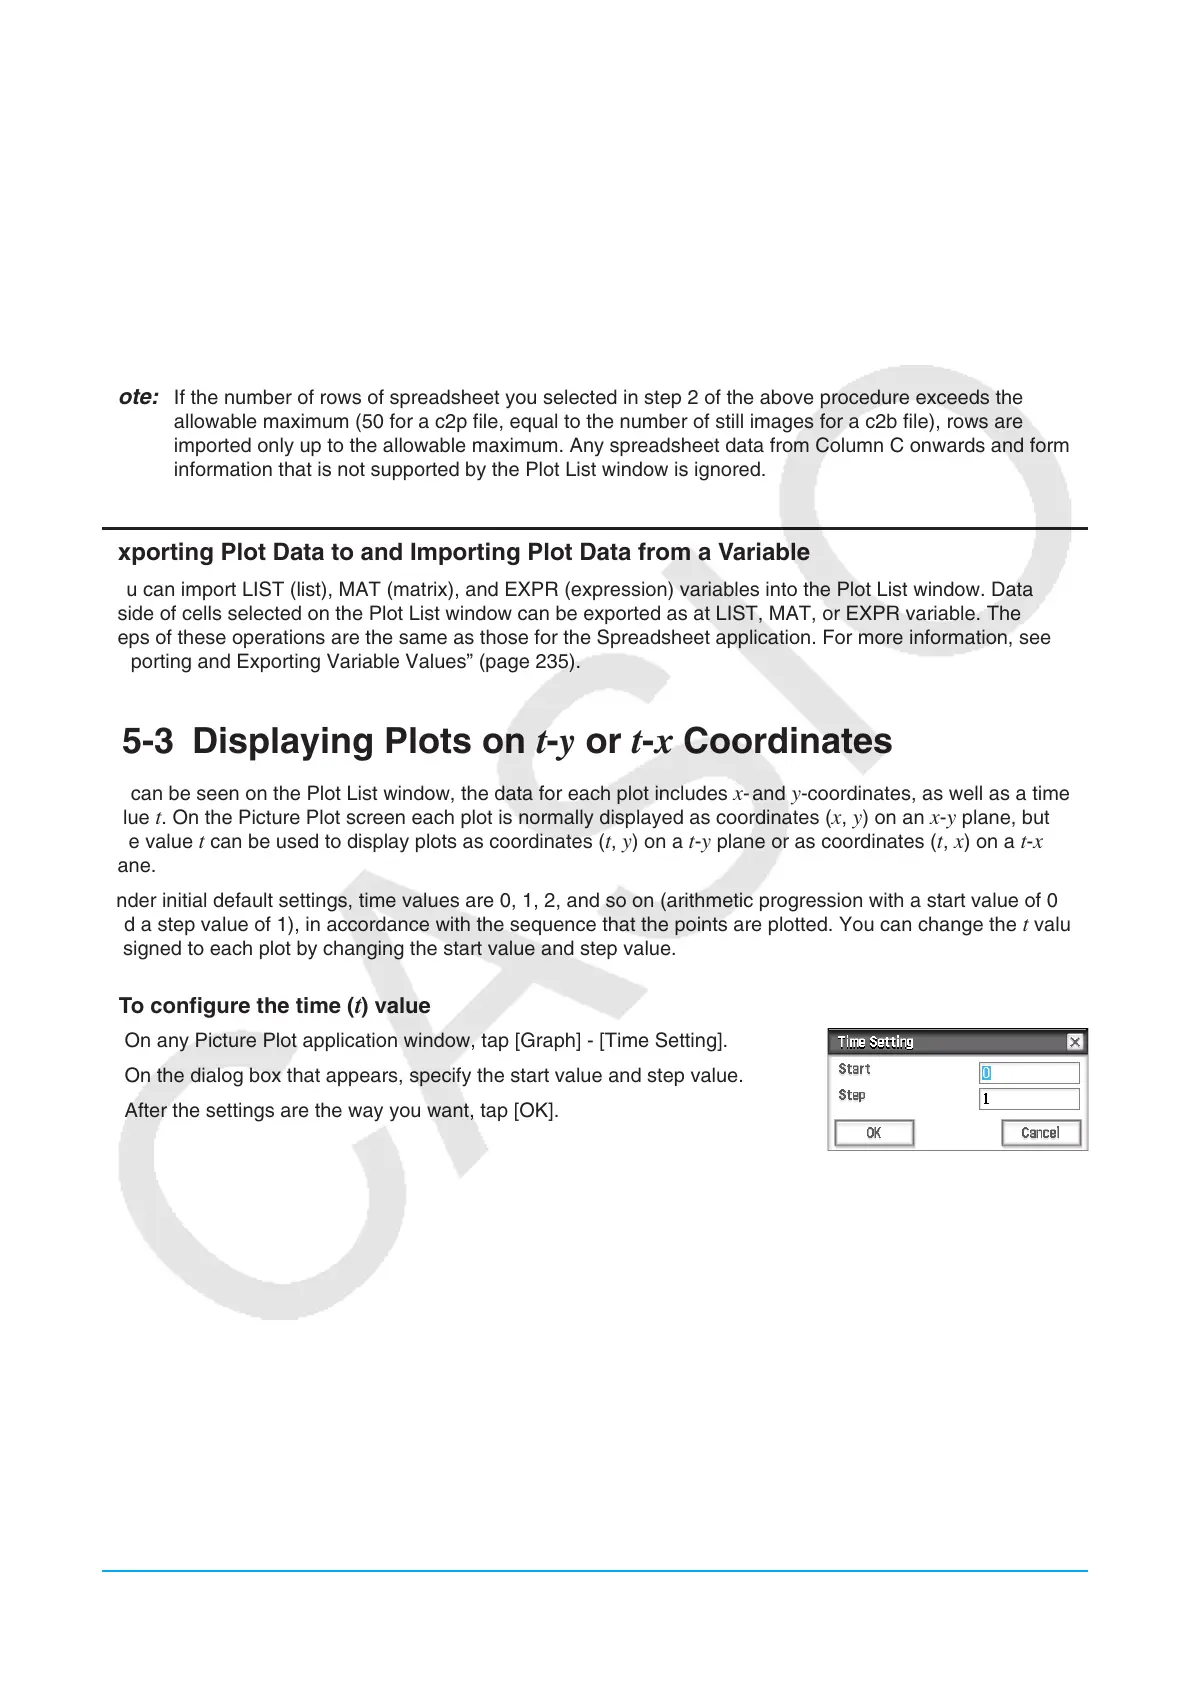
u To configure the time (t) value
1. On any Picture Plot application window, tap [Graph] - [Time Setting].
2. On the dialog box that appears, specify the start value and step value.
3. After the settings are the way you want, tap [OK].