Chapter 13: Spreadsheet Application 245
Single-variable, Paired-variable and Regression Calculations
When performing these calculations, you need to prepare data of one of the formats shown below.
(a) (b) (c) (d)
X1
X2
X3
X1
X2
X3
Freq 1
Freq 2
Freq 3
X1
X2
X3
Y1
Y2
Y3
X1
X2
X3
Y1
Y2
Y3
Freq 1
Freq 2
Freq 3
Single-variable Data Single-variable Data
with Frequencies
Paired-variable Data Paired-variable Data
with Frequencies
To perform this type of calculation: Prepare this type of data:
Single-variable calculations (a) or (b)
Paired-variable and regression calculations (c) or (d)
For any of the above calculations, selecting a command displays a wizard screen. The example below shows
how to perform a regression calculation.
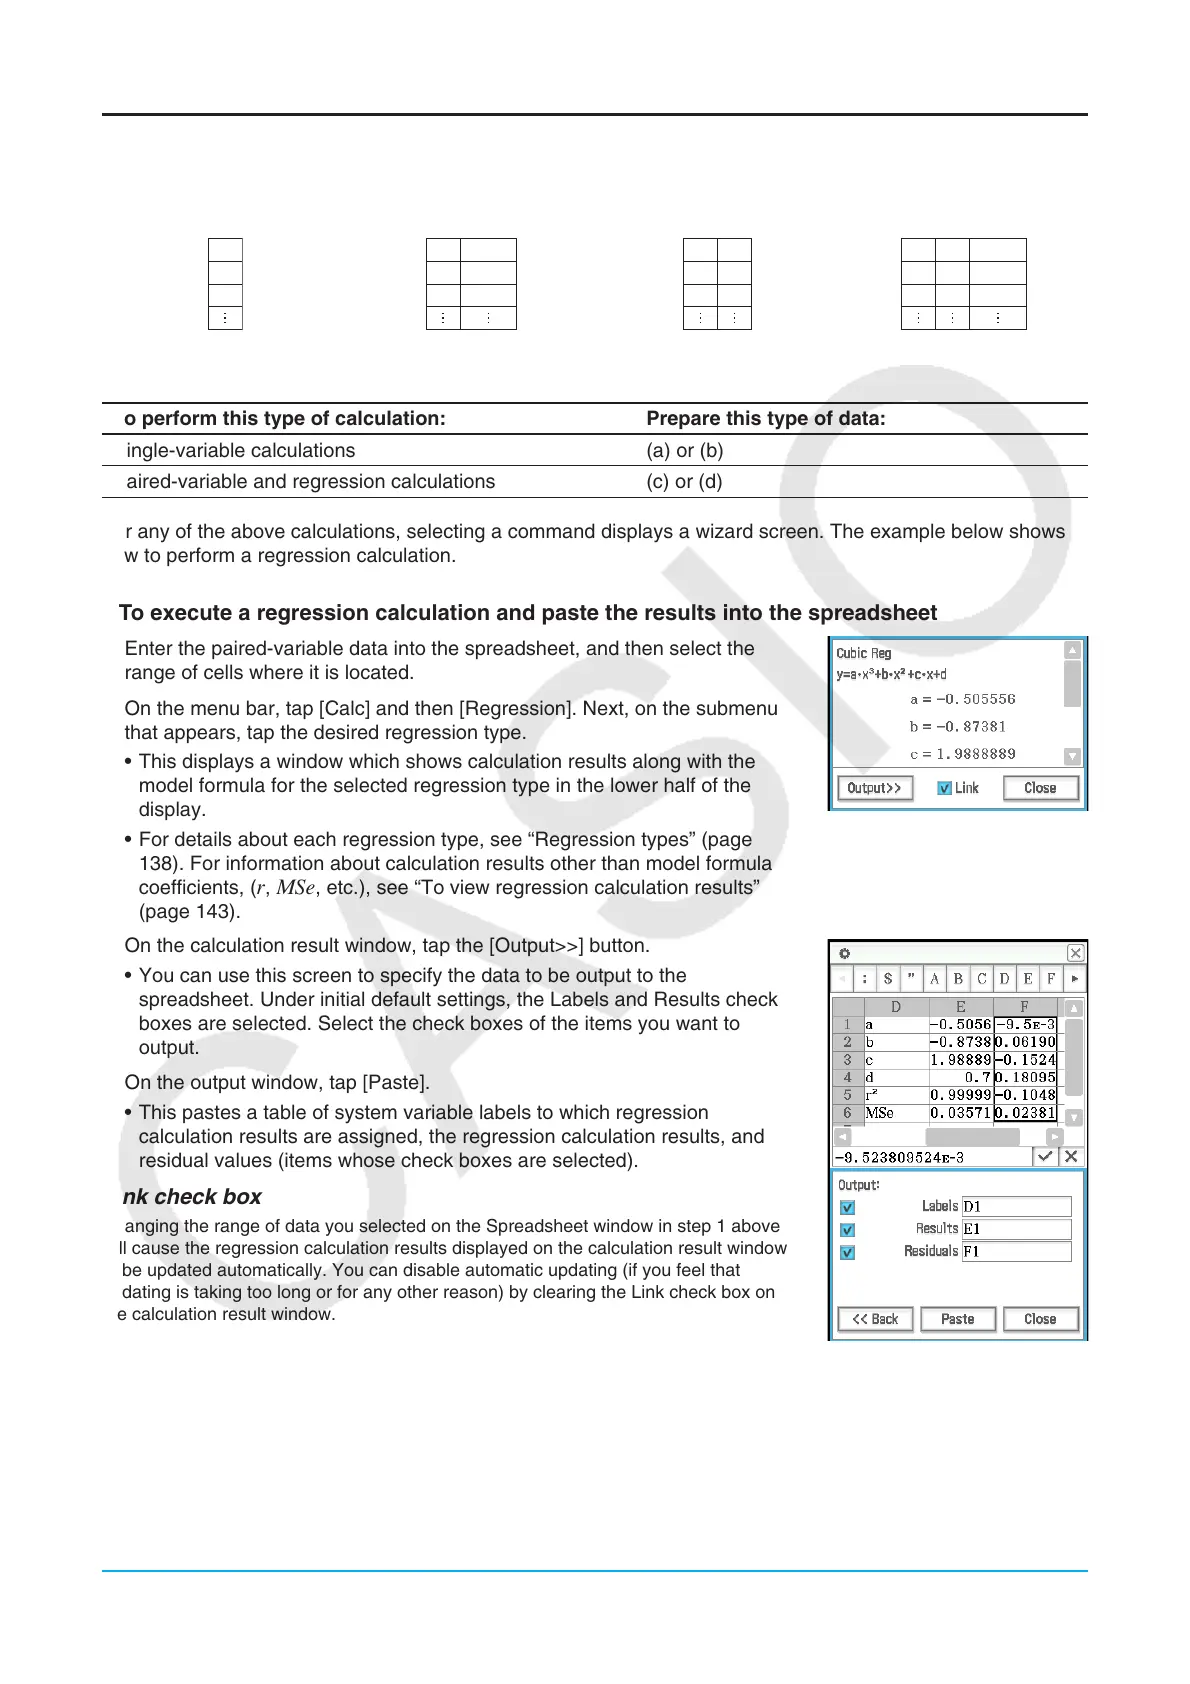
u To execute a regression calculation and paste the results into the spreadsheet
1. Enter the paired-variable data into the spreadsheet, and then select the
range of cells where it is located.
2. On the menu bar, tap [Calc] and then [Regression]. Next, on the submenu
that appears, tap the desired regression type.
• This displays a window which shows calculation results along with the
model formula for the selected regression type in the lower half of the
display.
• For details about each regression type, see “Regression types” (page
138). For information about calculation results other than model formula
coefficients, (
r, MSe, etc.), see “To view regression calculation results”
(page 143).
3. On the calculation result window, tap the [Output>>] button.
• You can use this screen to specify the data to be output to the
spreadsheet. Under initial default settings, the Labels and Results check
boxes are selected. Select the check boxes of the items you want to
output.
4. On the output window, tap [Paste].
• This pastes a table of system variable labels to which regression
calculation results are assigned, the regression calculation results, and
residual values (items whose check boxes are selected).
Link check box
Changing the range of data you selected on the Spreadsheet window in step 1 above
will cause the regression calculation results displayed on the calculation result window
to be updated automatically. You can disable automatic updating (if you feel that
updating is taking too long or for any other reason) by clearing the Link check box on
the calculation result window.
Tip: For information about regression graphing, see “Regression Graph Operations (Curve Fitting)” (page 242).