Chapter 14: 3D Graph Application 256
Inserting Text into a 3D Graph Window
You can insert text into a 3D Graph window and delete it as required.
For more information, see “To write text on the Graph window” on page 113, and “To clear figures inserted using
the Sketch menu” on page 112.
Calculating a z-value for Particular x- and y-values, or s- and t-values
Use the following procedure to calculate a z-value for given x- and y-values on the displayed graph.
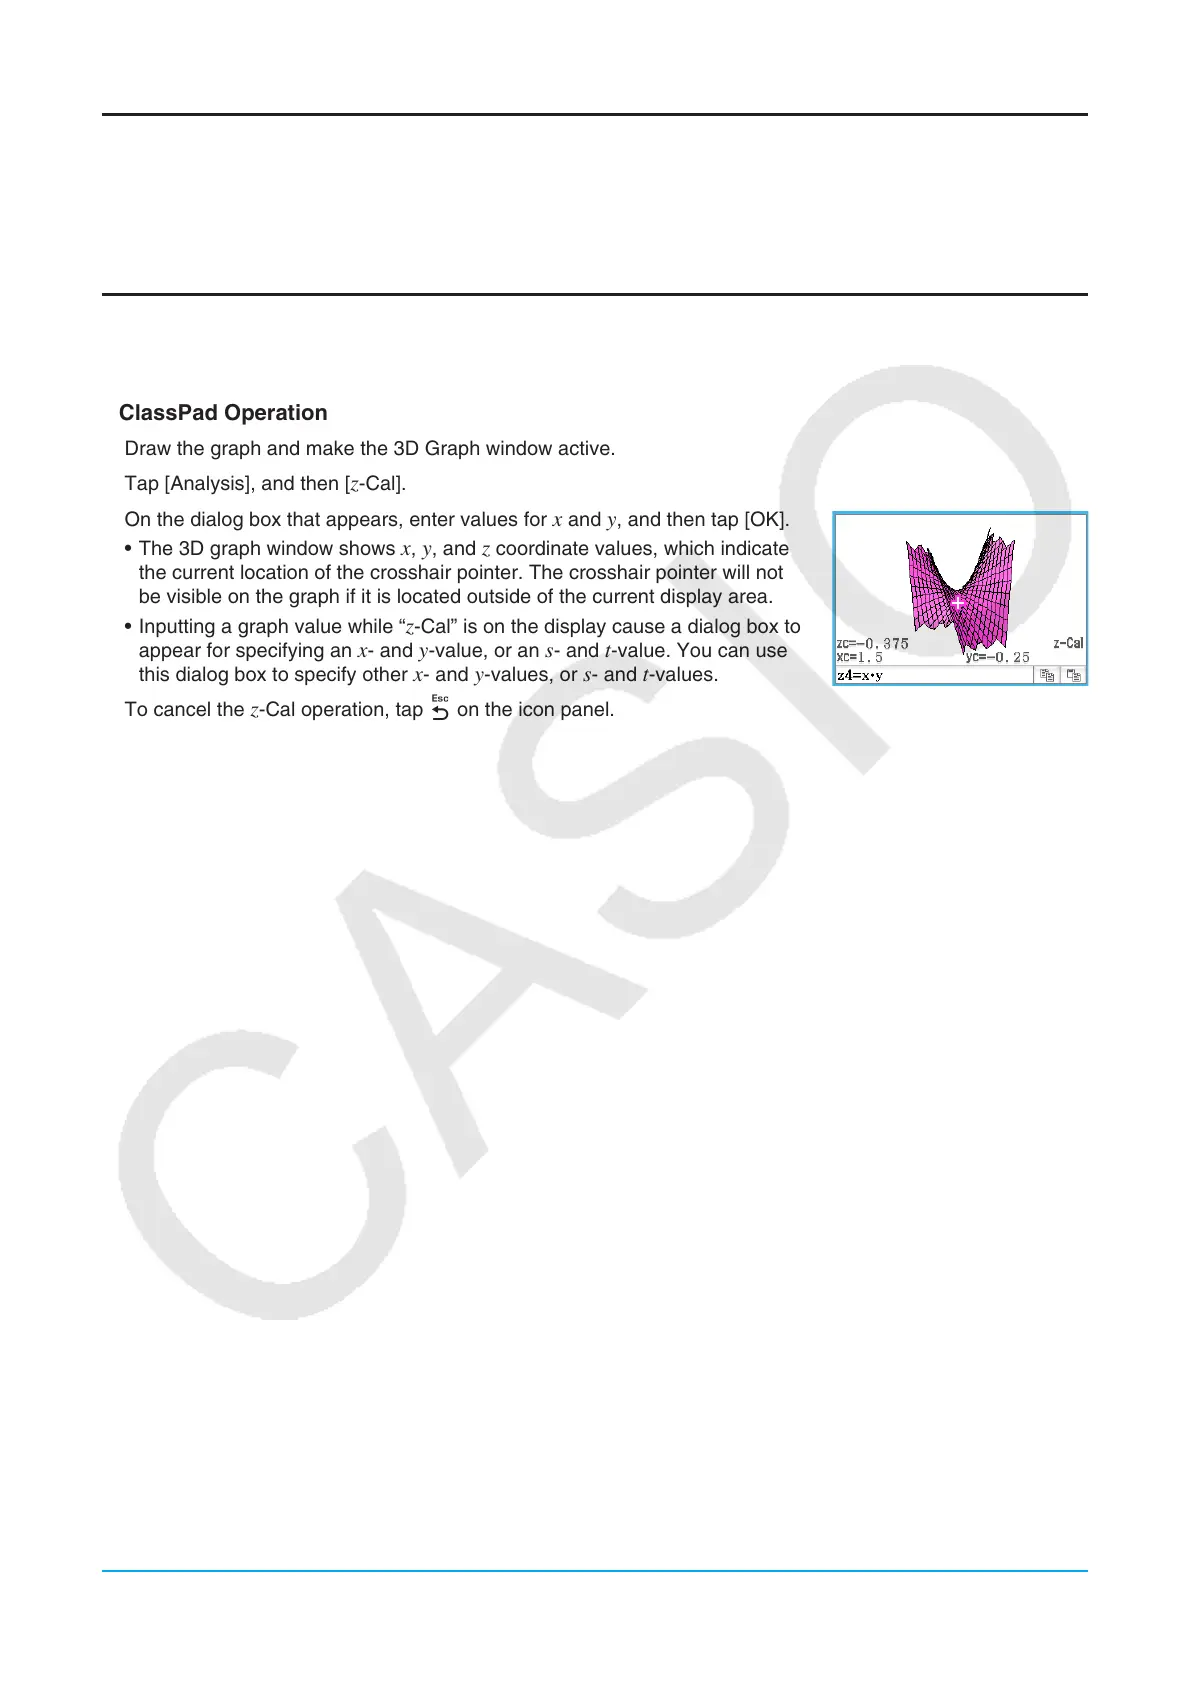
u ClassPad Operation
1. Draw the graph and make the 3D Graph window active.
2. Tap [Analysis], and then [
z-Cal].
3. On the dialog box that appears, enter values for
x and y, and then tap [OK].
• The 3D graph window shows
x, y, and z coordinate values, which indicate
the current location of the crosshair pointer. The crosshair pointer will not
be visible on the graph if it is located outside of the current display area.
• Inputting a graph value while “
z-Cal” is on the display cause a dialog box to
appear for specifying an x- and y-value, or an s- and t-value. You can use
this dialog box to specify other x- and y-values, or s- and t-values.
4. To cancel the
z-Cal operation, tap l on the icon panel.