Chapter 2: Main Application 93
• As can be seen in this example, a graph can be drawn by dropping an expression in the form of f ( x ) into the
Graph window.
• When dropping a formula into the 3D Graph window instead of the Graph window, the formula must be in
form
f ( x, y) (such as x^2+y^2).
Using the Stat Editor Window
You can use the Stat Editor window to create new LIST variables and edit existing LIST variables. You can also
use the Stat Editor window to specify a LIST variable’s name and display its contents.
u To use a LIST variable with data input using Stat Editor to perform a calculation in the work
area
0240 To input data into “list1” and “list2” using Stat Editor, and then perform the calculation list1+list2 in the
work area
• list1 through list6 are LIST type system variables. For more information, see “Main Memory Data Types”
(page 28).
• For information about inputting and editing list data using the Stat Editor, see Chapter 7.
u To use Stat Editor to recall a LIST variable created in the work area
0241 Continuing from example 0240 , to use Stat Editor to recall list variable “test”, which was created in the
work area
Using the Geometry Window
When there is a Geometry window on the display, you can drag values and expressions to the Geometry
window to draw the graph or figure of the value or expression. You can also drag a figure from the Geometry
window to the work area, which displays the corresponding expression or value.
u To drag an expression from the work area to the Geometry window
0242 To input the expression x
2
/5
2
+ y
2
/2
2
= 1 in the work area, and then drag it to the Geometry window
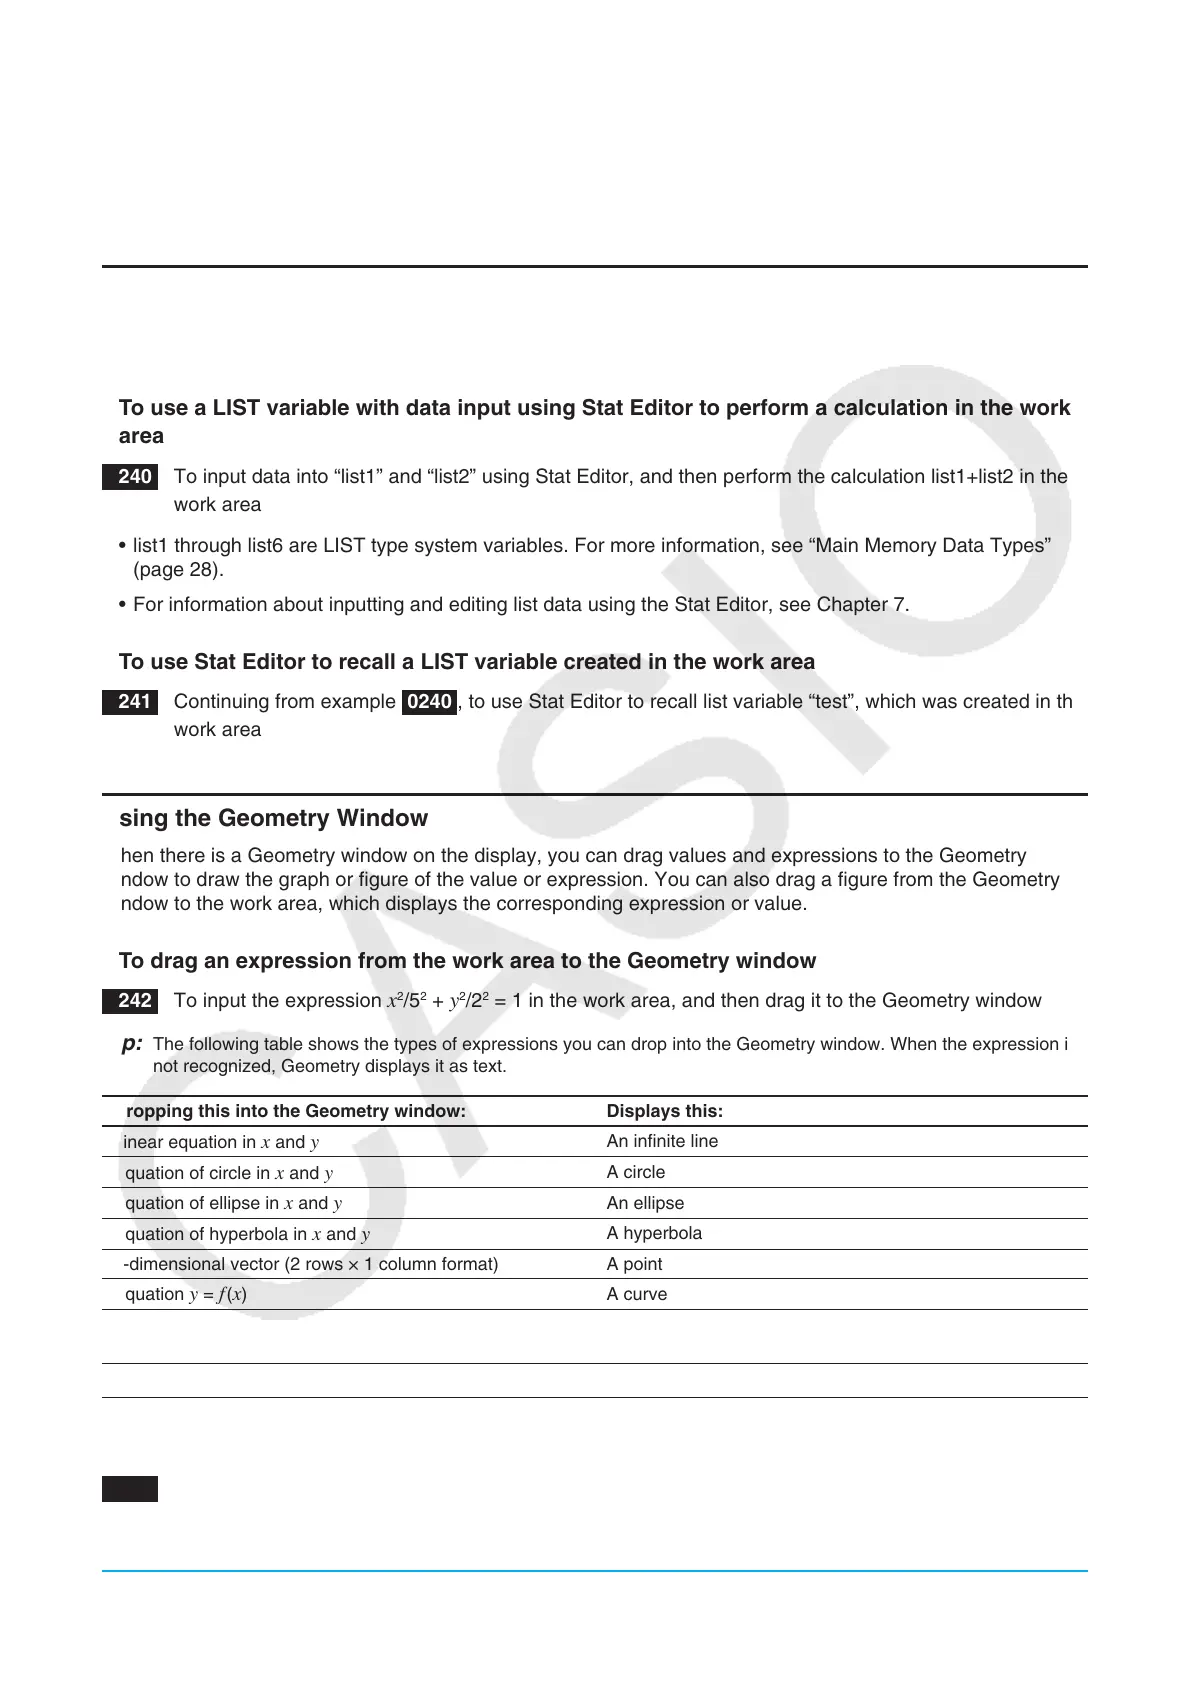
Tip: The following table shows the types of expressions you can drop into the Geometry window. When the expression is
not recognized, Geometry displays it as text.
Dropping this into the Geometry window: Displays this:
Linear equation in
x and y
An infinite line
Equation of circle in
x and y
A circle
Equation of ellipse in
x and y
An ellipse
Equation of hyperbola in
x and y
A hyperbola
2-dimensional vector (2 rows × 1 column format) A point
Equation
y = f ( x)
A curve
2 ×
n matrix, n t 3
A polygon (each column represents a vertex of the
polygon)
n × 2 matrix, n t 3
An open polygon
u To drag a figure from the Geometry window to the work area
0243 To drag a point, circle, point and its image from the Geometry window to the work area
• For details about Geometry window operations, see Chapter 8.