Chapter 12: Program Application 216Chapter 12: Program Application 216
OneVariable k
Syntax: OneVariable
xList [,FreqList (or 1)]
Function: Single variable statistics calculation
Description:
xList: Name of list for storing x-axis data
FreqList: Name of list for storing frequency of “
xList”
data
• “FreqList” can be omitted. Doing so sets “1” for
“FreqList”.
OneWayANOVA k
Syntax: OneWayANOVAFactorList(A),
DependentList
Function: See “One-Way ANOVA” (page 148).
OpenComPort38k I/O - Communication
Syntax: OpenComPort38k
Function: Opens the 3-pin COM port.
or Ctrl - Logic
See “Bitwise Operations” (page 60).
P
Pause Ctrl - Control
Syntax: Pause
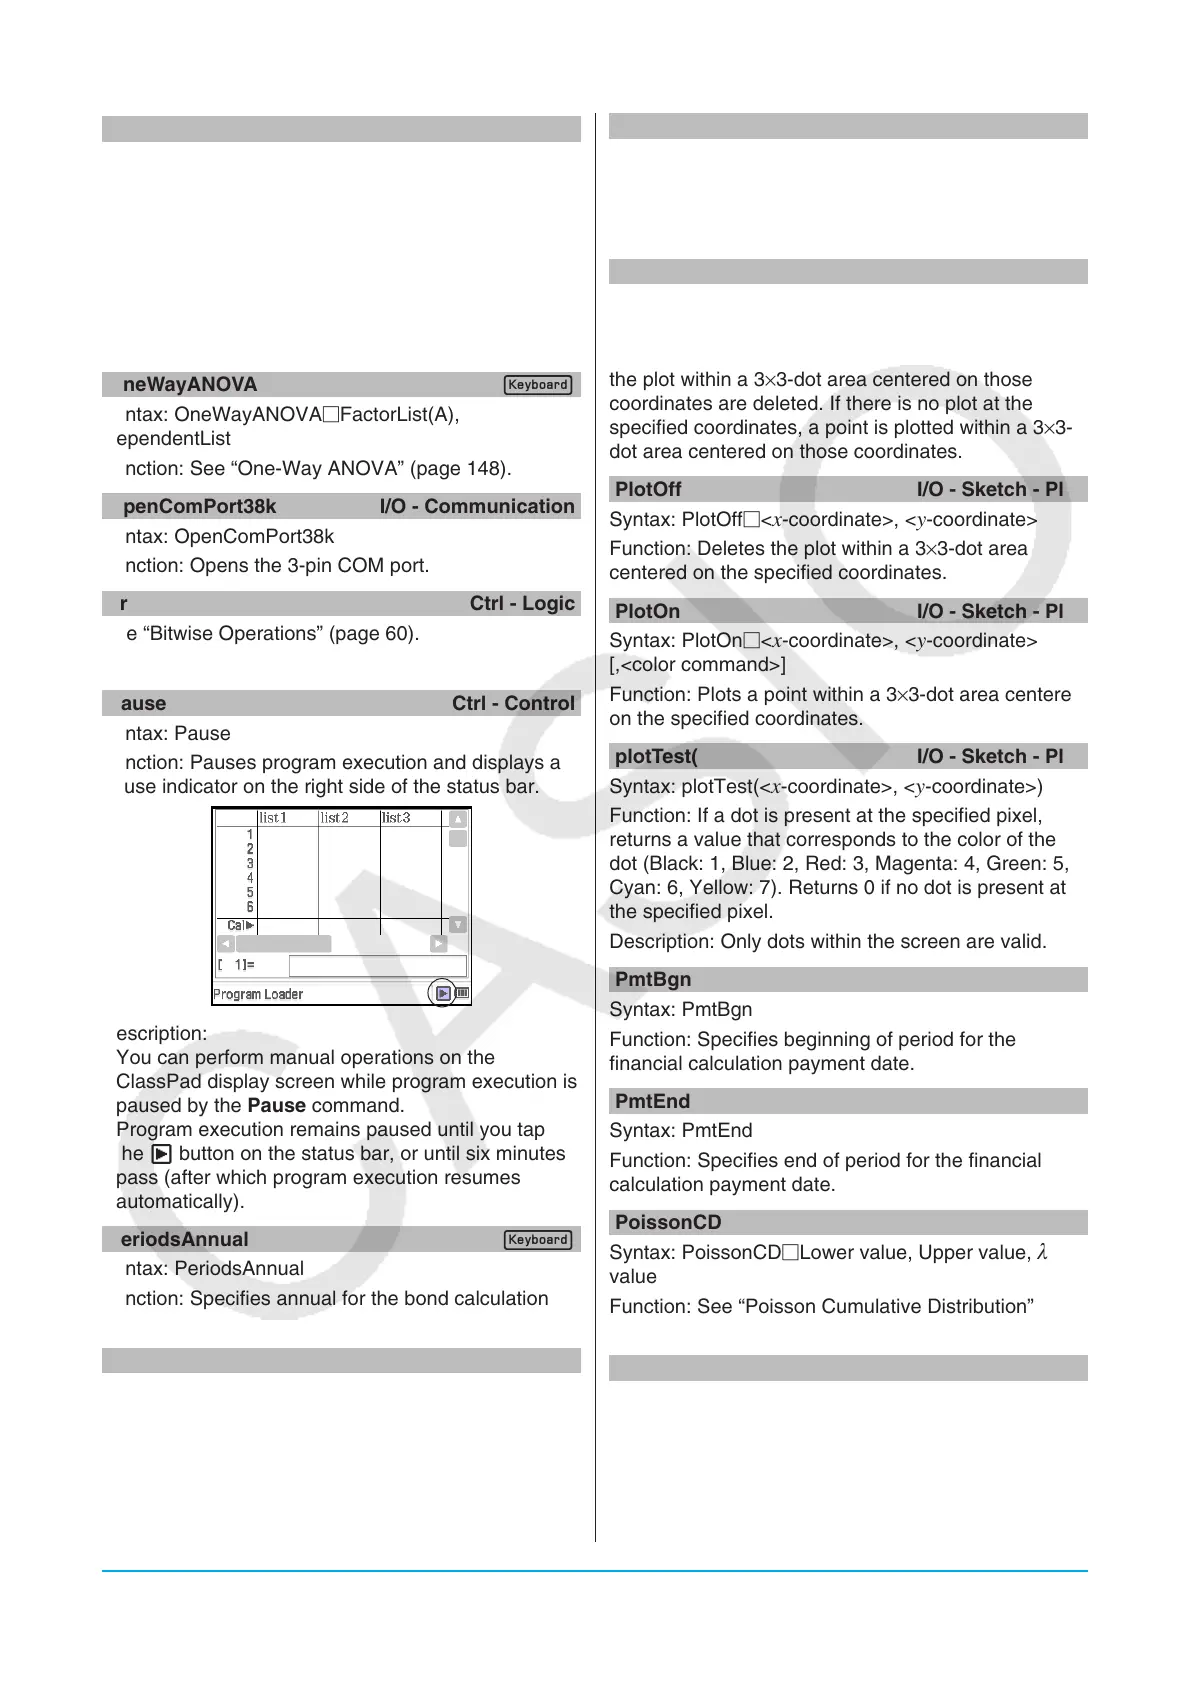
Function: Pauses program execution and displays a
pause indicator on the right side of the status bar.
Description:
• You can perform manual operations on the
ClassPad display screen while program execution is
paused by the Pause command.
• Program execution remains paused until you tap
the X button on the status bar, or until six minutes
pass (after which program execution resumes
automatically).
PeriodsAnnual k
Syntax: PeriodsAnnual
Function: Specifies annual for the bond calculation
payment periods
PeriodsSemi k
Syntax: PeriodsSemi
Function: Specifies semiannual for the bond
calculation payment periods
Plot I/O - Sketch - Plot
Syntax: Plot<
x-coordinate>, <y-coordinate>[,<color
command>]
Function: Displays a pointer at the location specified
by the coordinates and plots a point there.
PlotChg I/O - Sketch - Plot
Syntax: PlotChg<
x-coordinate>, <y-coordinate>
[,<color command>]
Function: If there is a plot at the specified coordinates,
the plot within a 3×3-dot area centered on those
coordinates are deleted. If there is no plot at the
specified coordinates, a point is plotted within a 3×3-
dot area centered on those coordinates.
PlotOff I/O - Sketch - Plot
Syntax: PlotOff<
x-coordinate>, <y-coordinate>
Function: Deletes the plot within a 3×3-dot area
centered on the specified coordinates.
PlotOn I/O - Sketch - Plot
Syntax: PlotOn<
x-coordinate>, <y-coordinate>
[,<color command>]
Function: Plots a point within a 3×3-dot area centered
on the specified coordinates.
plotTest( I/O - Sketch - Plot
Syntax: plotTest(<
x-coordinate>, <y-coordinate>)
Function: If a dot is present at the specified pixel,
returns a value that corresponds to the color of the
dot (Black: 1, Blue: 2, Red: 3, Magenta: 4, Green: 5,
Cyan: 6, Yellow: 7). Returns 0 if no dot is present at
the specified pixel.
Description: Only dots within the screen are valid.
PmtBgn k
Syntax: PmtBgn
Function: Specifies beginning of period for the
financial calculation payment date.
PmtEnd k
Syntax: PmtEnd
Function: Specifies end of period for the financial
calculation payment date.
PoissonCD k
Syntax: PoissonCDLower value, Upper value,
value
Function: See “Poisson Cumulative Distribution”
(page 153).
PoissonPD k
Syntax: PoissonPD
x value, value
Function: See “Poisson Distribution Probability” (page
152).

 Loading...


