– 7 –
1 1040 7.05 10.24 327.66
2 1505 7.51 15.79 279.61
3 2000 7.78 21.74 257.26
4 2560 7.88 28.17 240.67
5 3020 7.58 32.00 233.02
6 3500 7.27 35.53 233.15
7 4010 6.61 37.02 241.72
Sample
Engine Speed
n [rpm]
Torque
T0 [kgf
.
m]
Output
N0 [PS]
Fuel Efficiency
f0 [gf/PSh]
E-4 Automobile Gasoline Engine Efficiency
The following is a table of fuel efficiency measurement results for an automobile gasoline
engine. Draw a graph of the rate of change in the data.
■ Measurement Results
■ Graphic Calculator Operation
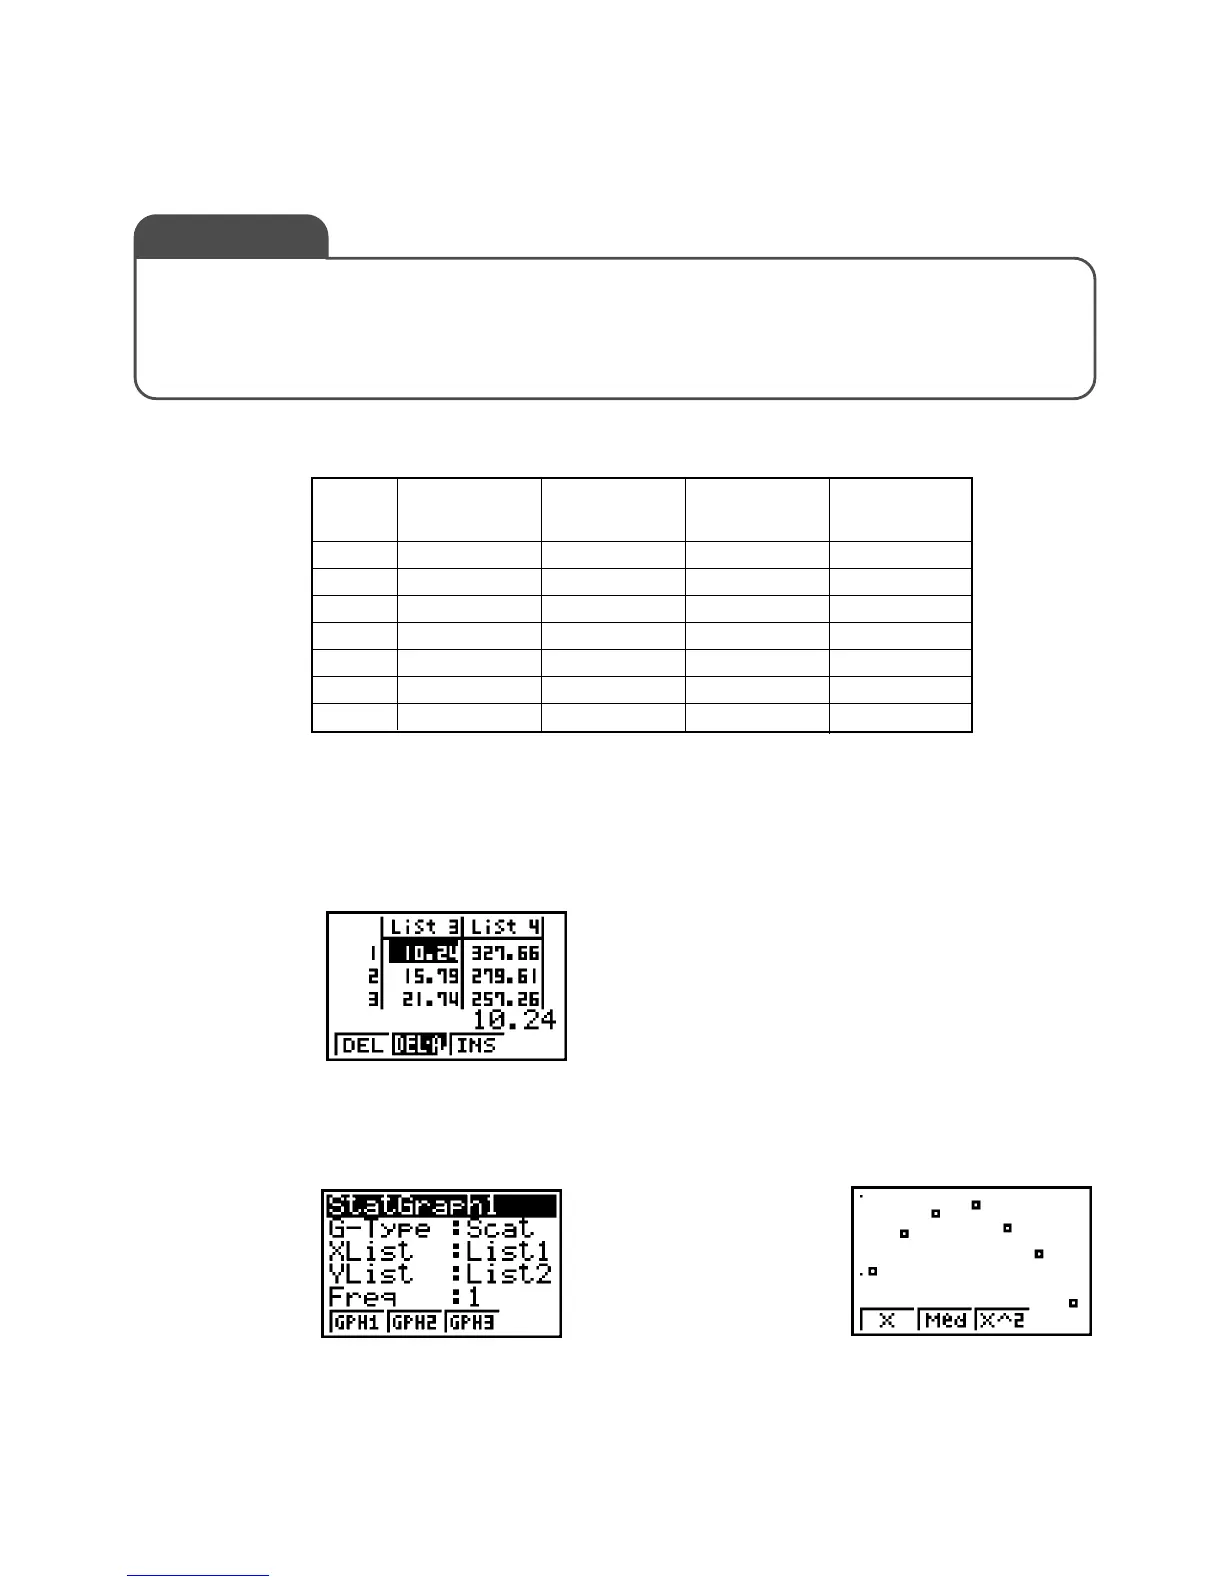
1. Data Input
From the Main Menu, enter the STAT Mode.
Input the data into List 1 to List 4.
List 1: Engine speed
List 2: Torque
List 3: Output
List 4: Fuel Efficiency
2. Engine Speed – Torque Graph: Graph 1
Stat Graph 1: Make List 2 the YList.
Q
1(GRPH)
1(GPH1)
Graph 1
Exercise
1(GRPH)
[
4(SET)

 Loading...


