– 35 –
Results (Example)
Graphic Calculator Operation
2-1. Determination of Maximum Value
As in 1-1 and 1-6 of EC-1(Density of a Liquid), select the STAT Mode, input the data, and draw
the regression curve.
This type of “viscosity measurement graph” exhibits a quadratic curve form. By determining the
maximum value (peak) of this regression curve yields the concentration at which maximum
viscosity is achieved as well as the viscosity at that point.
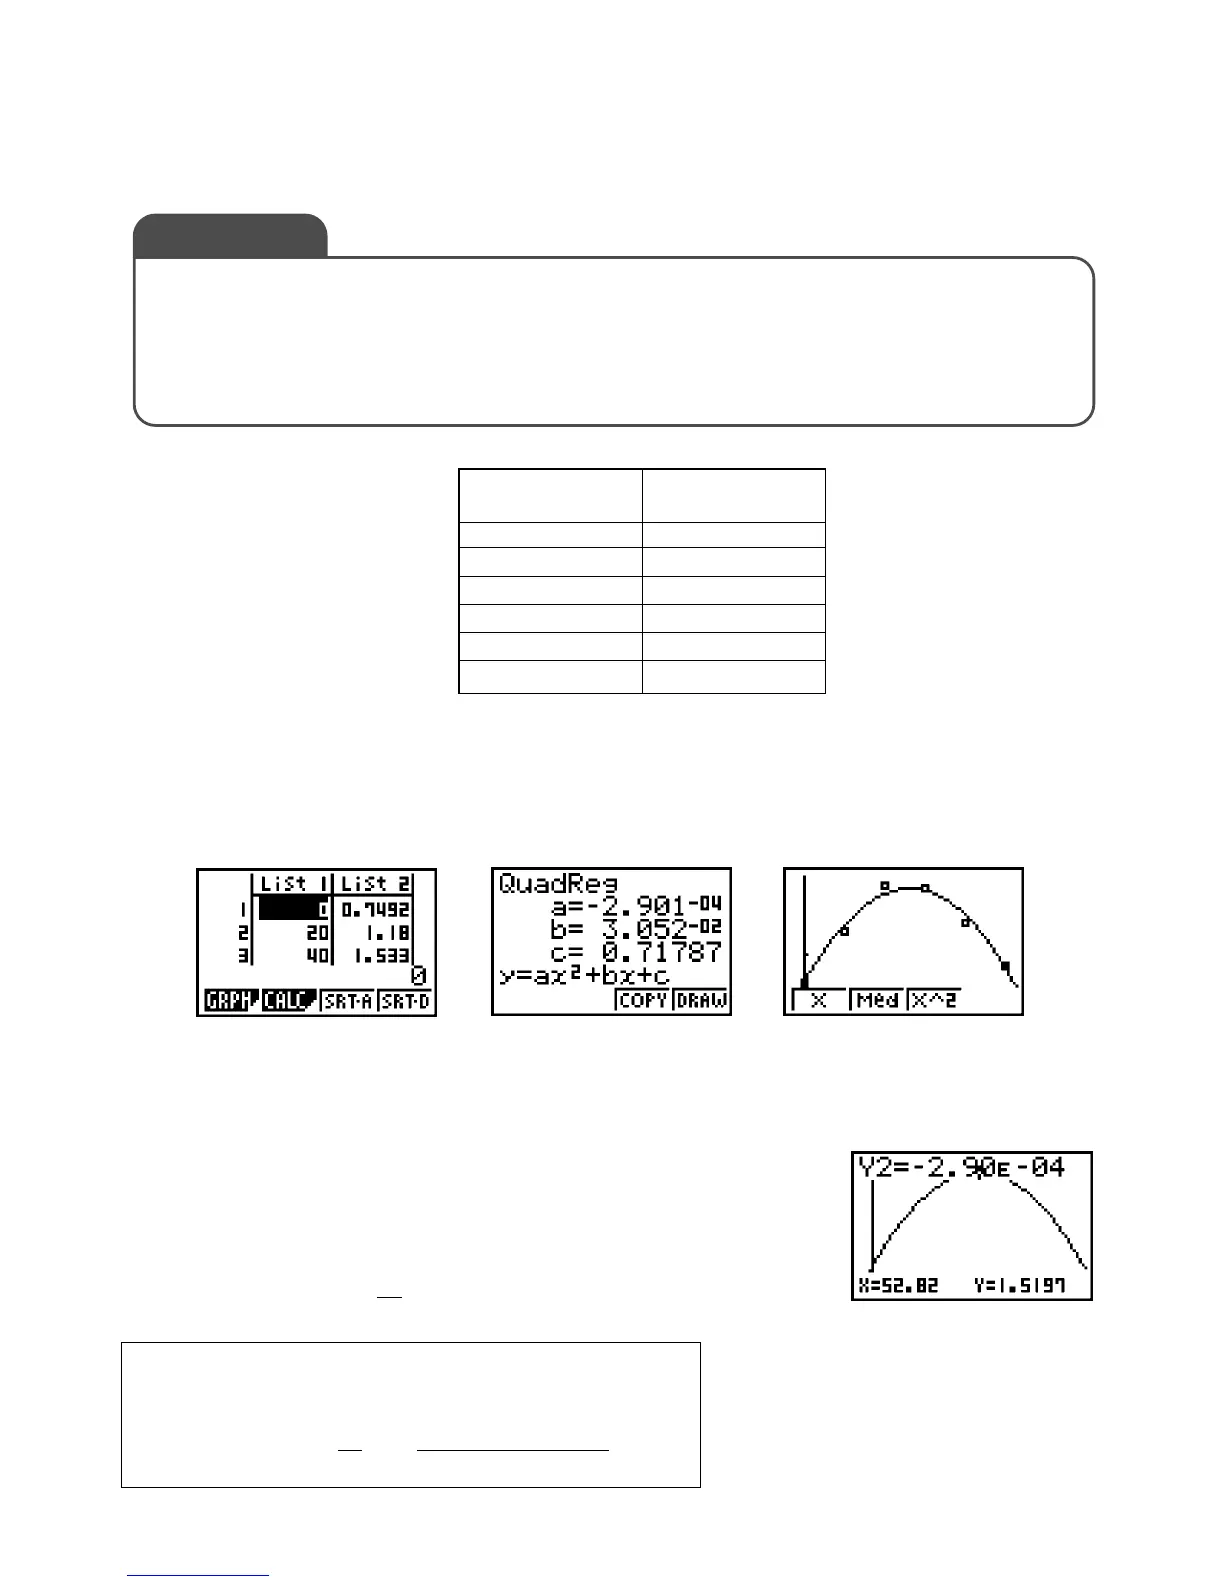
As in 1-8, display the graph of the regression expression copied to the
graph menu and then press !1(TRCE) to move the cursor to
X = 52.82. This reveals that the maximum value of Y is 1.5197.
You can also obtain the maximum value as shown below.
Quadratic Regression Values
a = –2.901 10
–4
, b = 0.03052, c = 0.7179
Calculation
EC-2 Viscosity of a Liquid
Measuring the Viscosity of a Liquid
Solutions of ethanol and water are prepared in concentrations of 0, 20, 40, 60, 80, and 100
wt%. An Oswald viscometer is used to measure the flow time and determine the viscosity of
each sample. Results are used to create and study a concentration - viscosity curve.
Exercise
00.7192
20 1.180
40 1.533
60 1.511
80 1.239
100 0.900
Ethanol
Concentration (wt%)
Viscosity
η (mPas)
–
b
=
–
0.03052
= 52.6
2a
2 (–2.90110
–4
)
y = 2ax + b = 0 → x =
–
b
2a

 Loading...


