– 32 –
Results (Example)
When the specific gravity flask mass m
0
= 11.0205 (g) and the density of water ρ
w
is 0.9940
(g/cm
3
), the volume of the specific gravity flask is:
Sample solution density ρ (g/cm
3
) is the following:
Graphic Calculator Operation
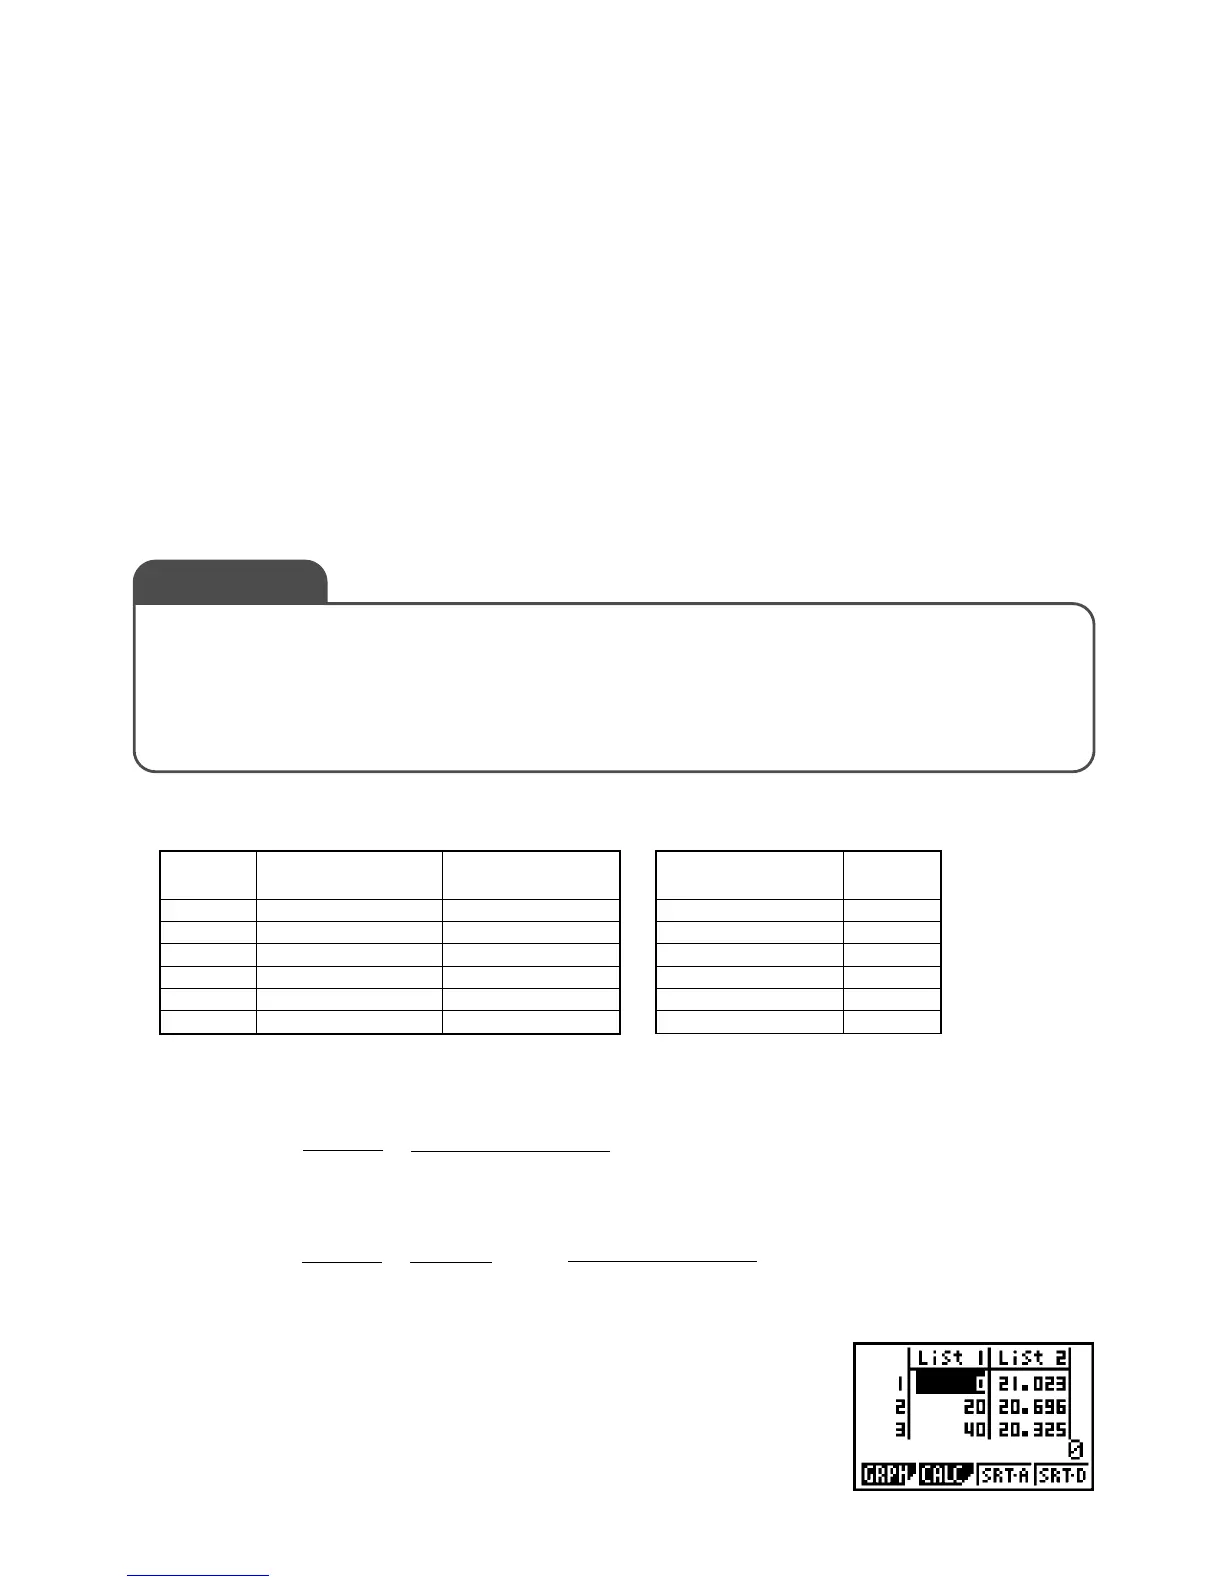
1-1. Data Input
From the Main Menu, enter the STAT Mode, and then input
the concentration values into List 1 (0 to 100).
Also, input the measurement results (mass) into List 2.
EC-1 Density of a Liquid
Measuring the Density of a Liquid
Solutions of ethanol and water are prepared in concentrations of 0, 20, 40, 60, 80, and 100
wt%. Each sample is poured into a specific gravity flask, its mass is measured under
constant temperature, and the density of each is calculated. Results are used to create and
study a concentration – density curve.
Exercise
V =
m
1
– m
0
=
21.0233 – 11.0205
= 10.063 [cm
3
]
ρ
w
0.9940
ρ =
m
2
– m
0
=
m
2
– m
0
ρ
w
=
m
2
– 11.0205
0.9940 [g/cm
3
]
V m
1
– m
0
21.0233 – 11.0205
10 (Water) 21.0233
220 20.6962
340 20.3251
460 19.8745
580 19.3807
6 100 18.8342
Sample
Number
Ethanol Concentration
(wt%)
Specific Gravity Flask +
Sample Mass m
2
(g)
Table 1 — Measurement Results
00.9940
20 0.9615
40 0.9246
60 0.8798
80 0.8308
100 0.7765
Ethanol Concentration
(wt%)
Density ρ
(g/cm
3
)
Table 2 — Calculation Results
In exercises that involve measurements, the most common approach is to perform calculations
and draw graphs based on measurement results, and then to study tendencies, estimated
values, and other factors. This exercise is a practical application of a physical chemistry
exercise (physical measurement) using the graphic calculator.
Among physical chemistry exercise types are those that measure the physical properties of
liquid. These types of exercises measure density, viscosity, surface elasticity, index of refraction,
angle of rotation, etc. All such exercises measure physical properties as the concentration of a
liquid changes, and graphs the changes in order to make estimates and to study various
properties affected by the changes.
The practical exercise presented here shows how to graph measurement results.

 Loading...


