– 68 –
Z-2Using a Graphic Calculator
(Inputting Statistical Data)
Table Input
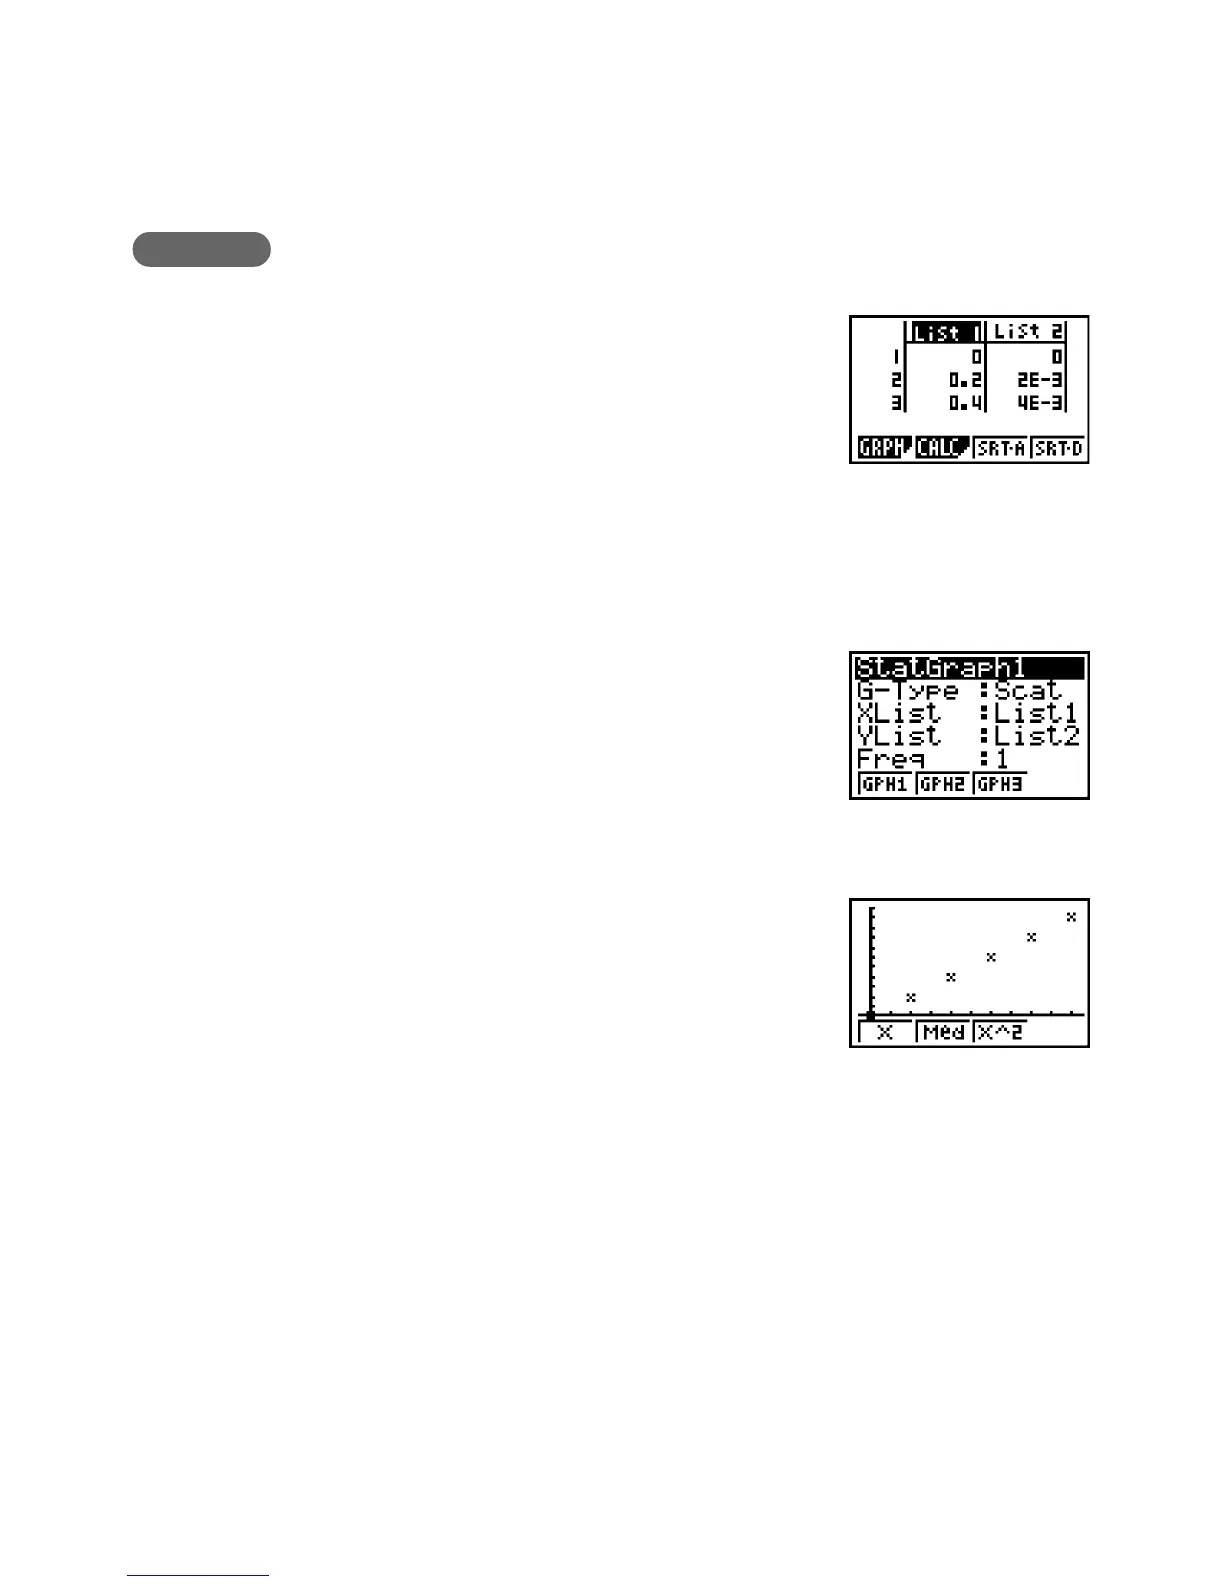
From the Main Menu, enter the STAT Mode.
After confirming the cursor is in line 1 of List 1, input the
voltage values.
(0 w 0.2 w 0.4 w, etc.)
After confirming the cursor is in line 1 of List 2, input the
current values.
(0 w 0.002 w 0.004 w, etc.)
Graph Settings
Press 1(GRPH) [4(SET) to check the graph
settings. Use f and c to move the cursor around the
display and use keys 1 through [ to change the
settings so they are like the ones shown on the screen
nearby.
Graphing
Press Q1(GRPH) 1(GPH1) to display the graph
(scatter diagram).
k Data Editing
•To change data, move the cursor to the data you want to change and over write it with the
correct data.
•To insert data, move the cursor to the location of the insert, and then press [3(INS).
•To delete data, move the cursor to the data you want to delete, and then press [
1 (DEL).
* To return from the graph screen to the data input screen, press Q.
Operation

 Loading...


