– 69 –
Z-3Using a Graphic Calculator
(Determining the Slope of a Line)
Graphing
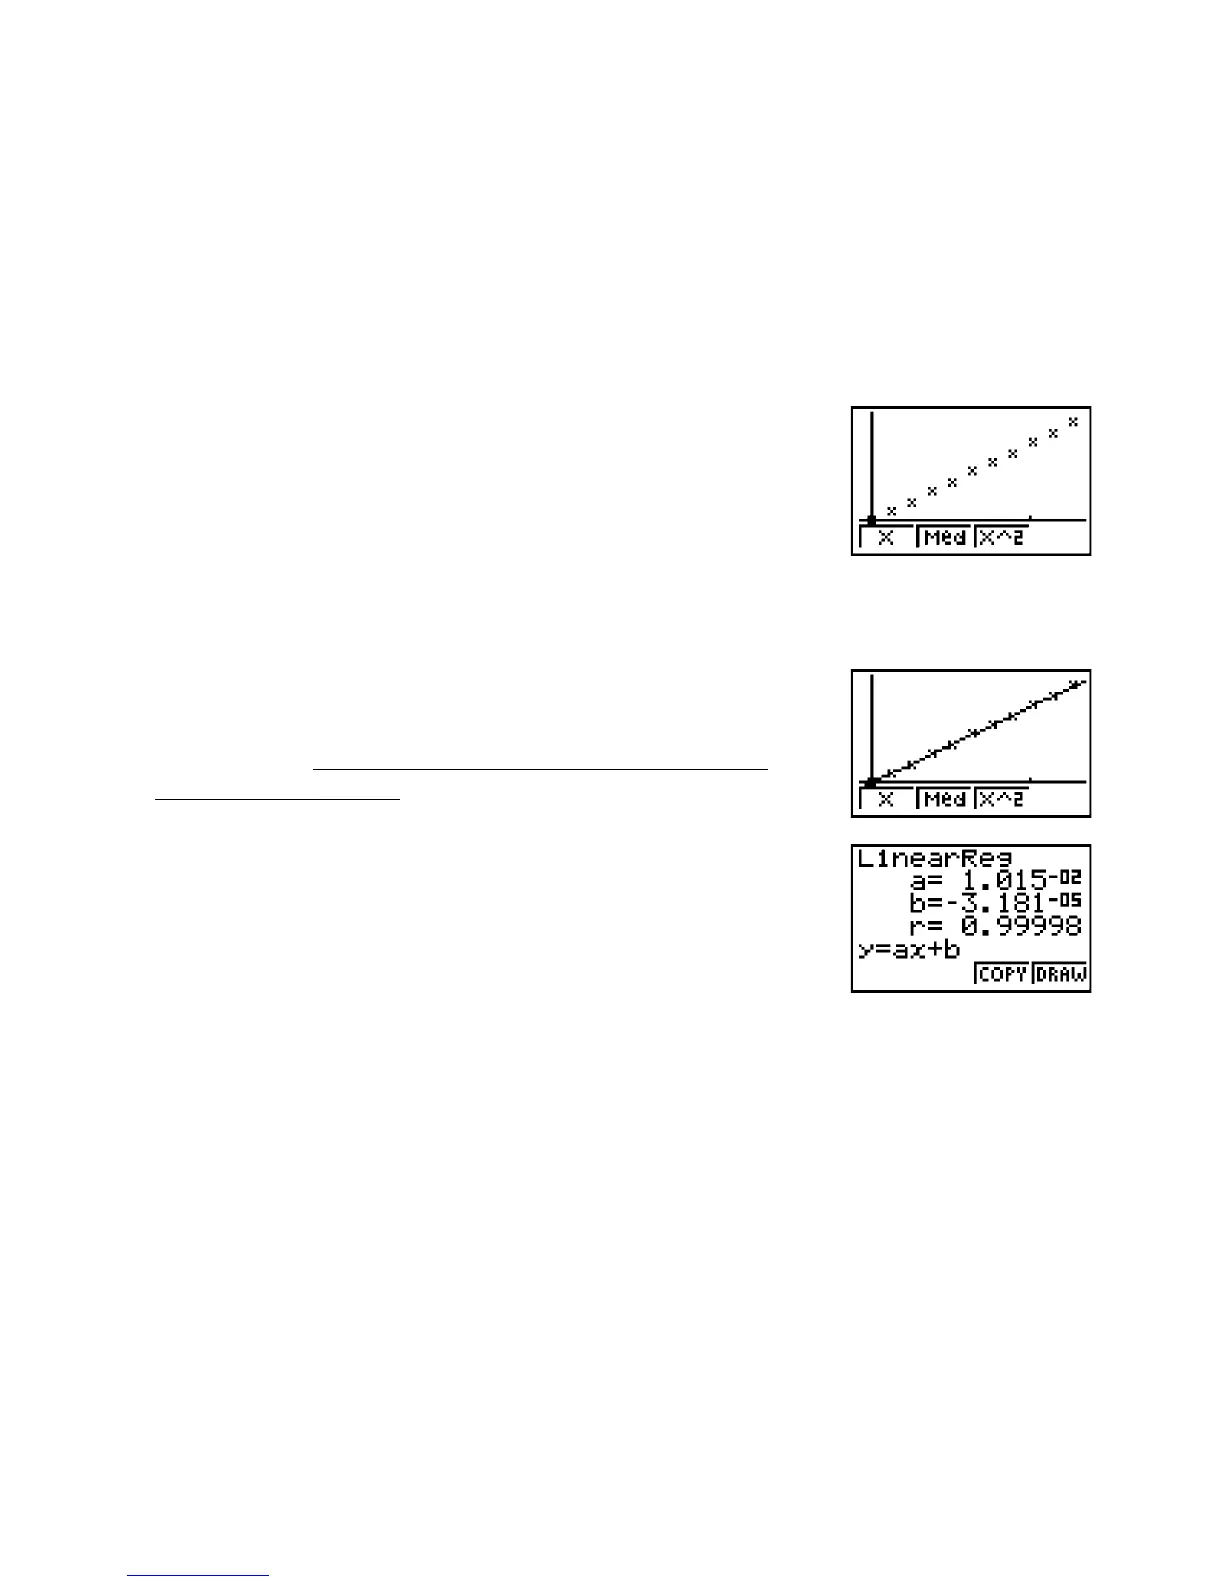
Press Q1(GRPH) 1(GPH1) to display the graph
(scatter diagram).
Linear Regression
Pressing 1(X) 4(DRAW) performs linear regression
and overlays it onto the scatter diagram as shown on the
screen nearby. Pressing 1 displays the slope, which is the
value indicated for “a =”.
Calculation of the slope and other information from the obtained data is performed using linear
regression. Though the actual calculation is quite complex and difficult to perform, the graphic
calculator performs linear regression in an instant and provides the slope and y-intercept.

 Loading...


