– 3 –
E-2 Function Expressing the Relationship
Between Time Taken and Distance Traveled
1. Input the table.
From the Main Menu, enter the STAT Mode.
After making sure the first line of List 1 is highlighted, input the
following.
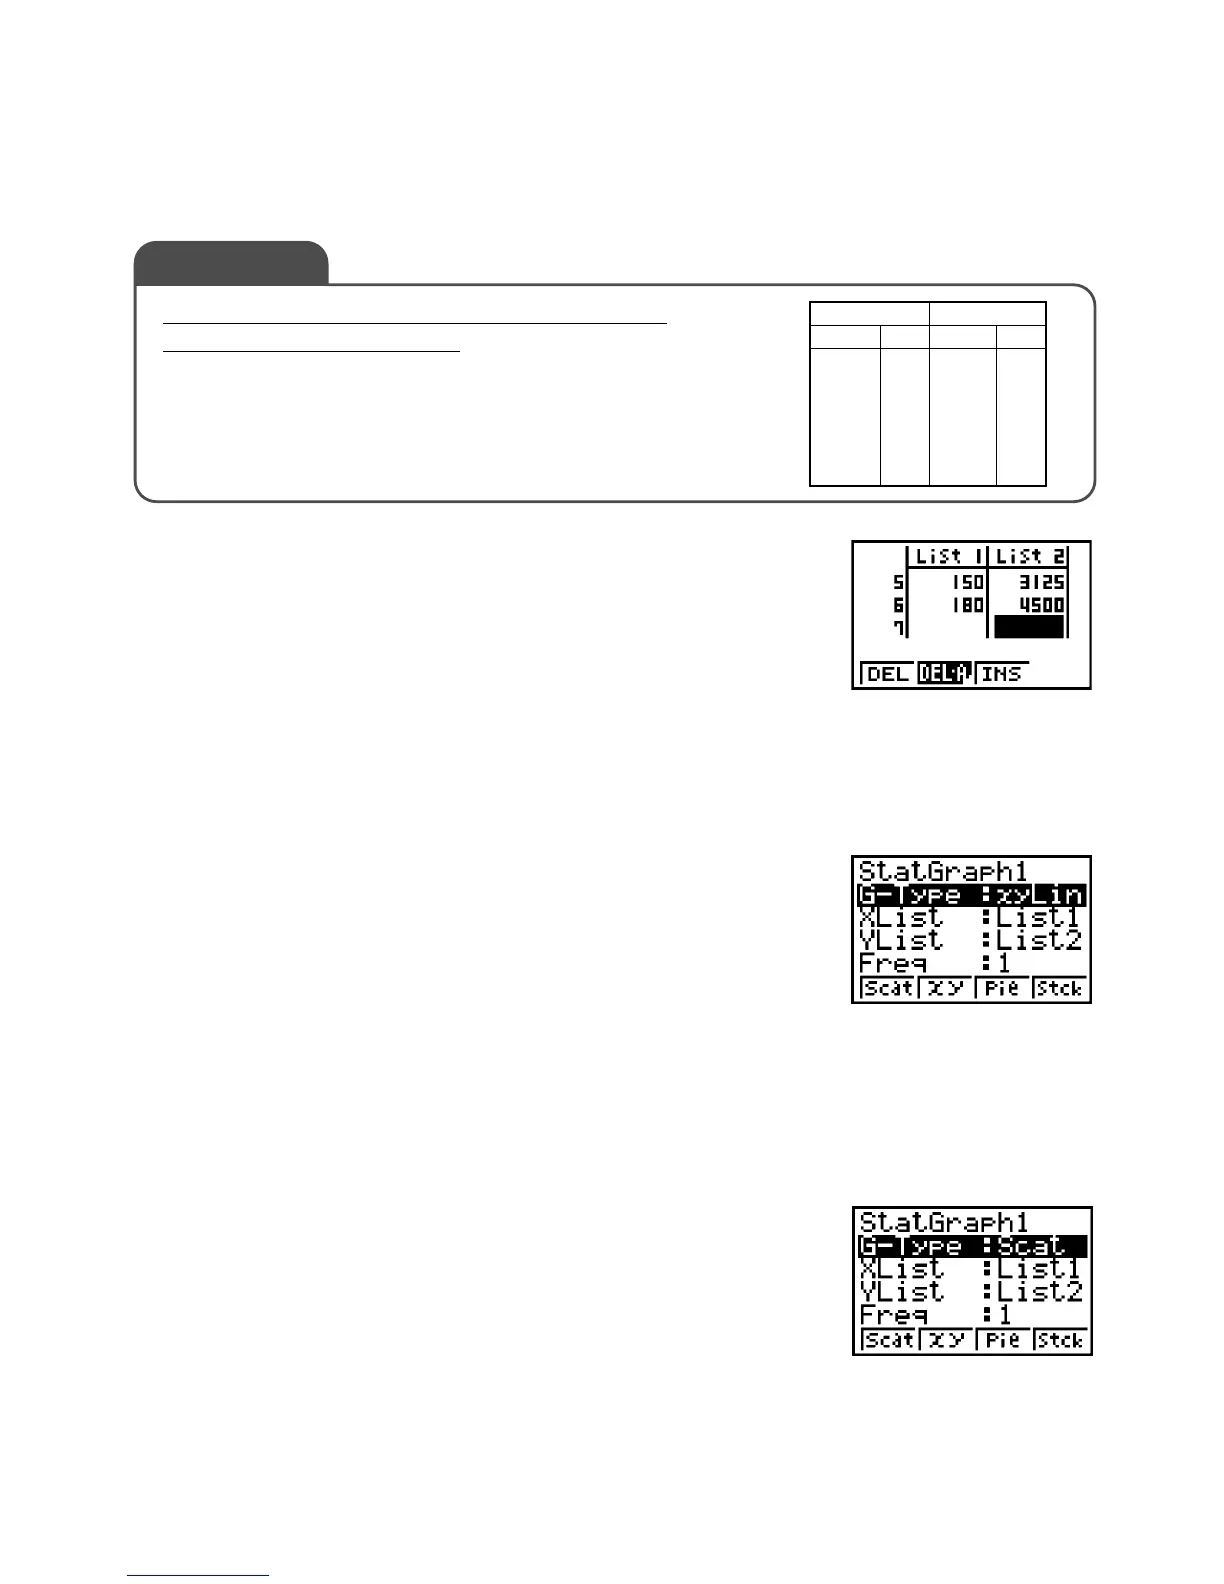
30w60w90w • • • 180w
After making sure the first line of List 2 is highlighted, input the
following.
125w500w1125w • • • 4500w
2. Configure graph settings.
Press 1(GRPH) [4(SET) and check the graph set-
tings.
Use f and c to move the highlighting to G-Type.
Press 2(xy) so the screen appears as shown to the right.
3. Draw the graph.
Press Q1(GRPH)1(GPH1) to display a graph in which
plotted points are linked.
4. Configure graph 2.
Press Qand then 1(GRPH)[4(SET), and check
the graph settings.
Move the highlighting to G-Type and then press 1(Scat).
The display should change as shown to the right.
Function Expressing the Relationship Between
Time and Distance Traveled
The nearby table is being configured for
s = f(t)[m],
when it is assumed that distance covered s [m] is a
function of time taken t [sec]. Complete the table
and graph the expression f(t).
Exercise
Time t Distance s
[min] [sec] [km] [m]
0.5 0.125
1.0 0.500
1.5 1.125
2.0 2.000
2.5 3.125
3.0 4.500
JIKKYO SHUPPAN CO., LTD.: SHIN KOGYO SURI
(NEW EDITION)

 Loading...


