– 13 –
S-1 Histogram
Use a graphic scientific calculator to graph statistics.
Procedure: Input data into List 1. Select the input data and graph type.
Solution: From the Main Menu, enter the STAT Mode.
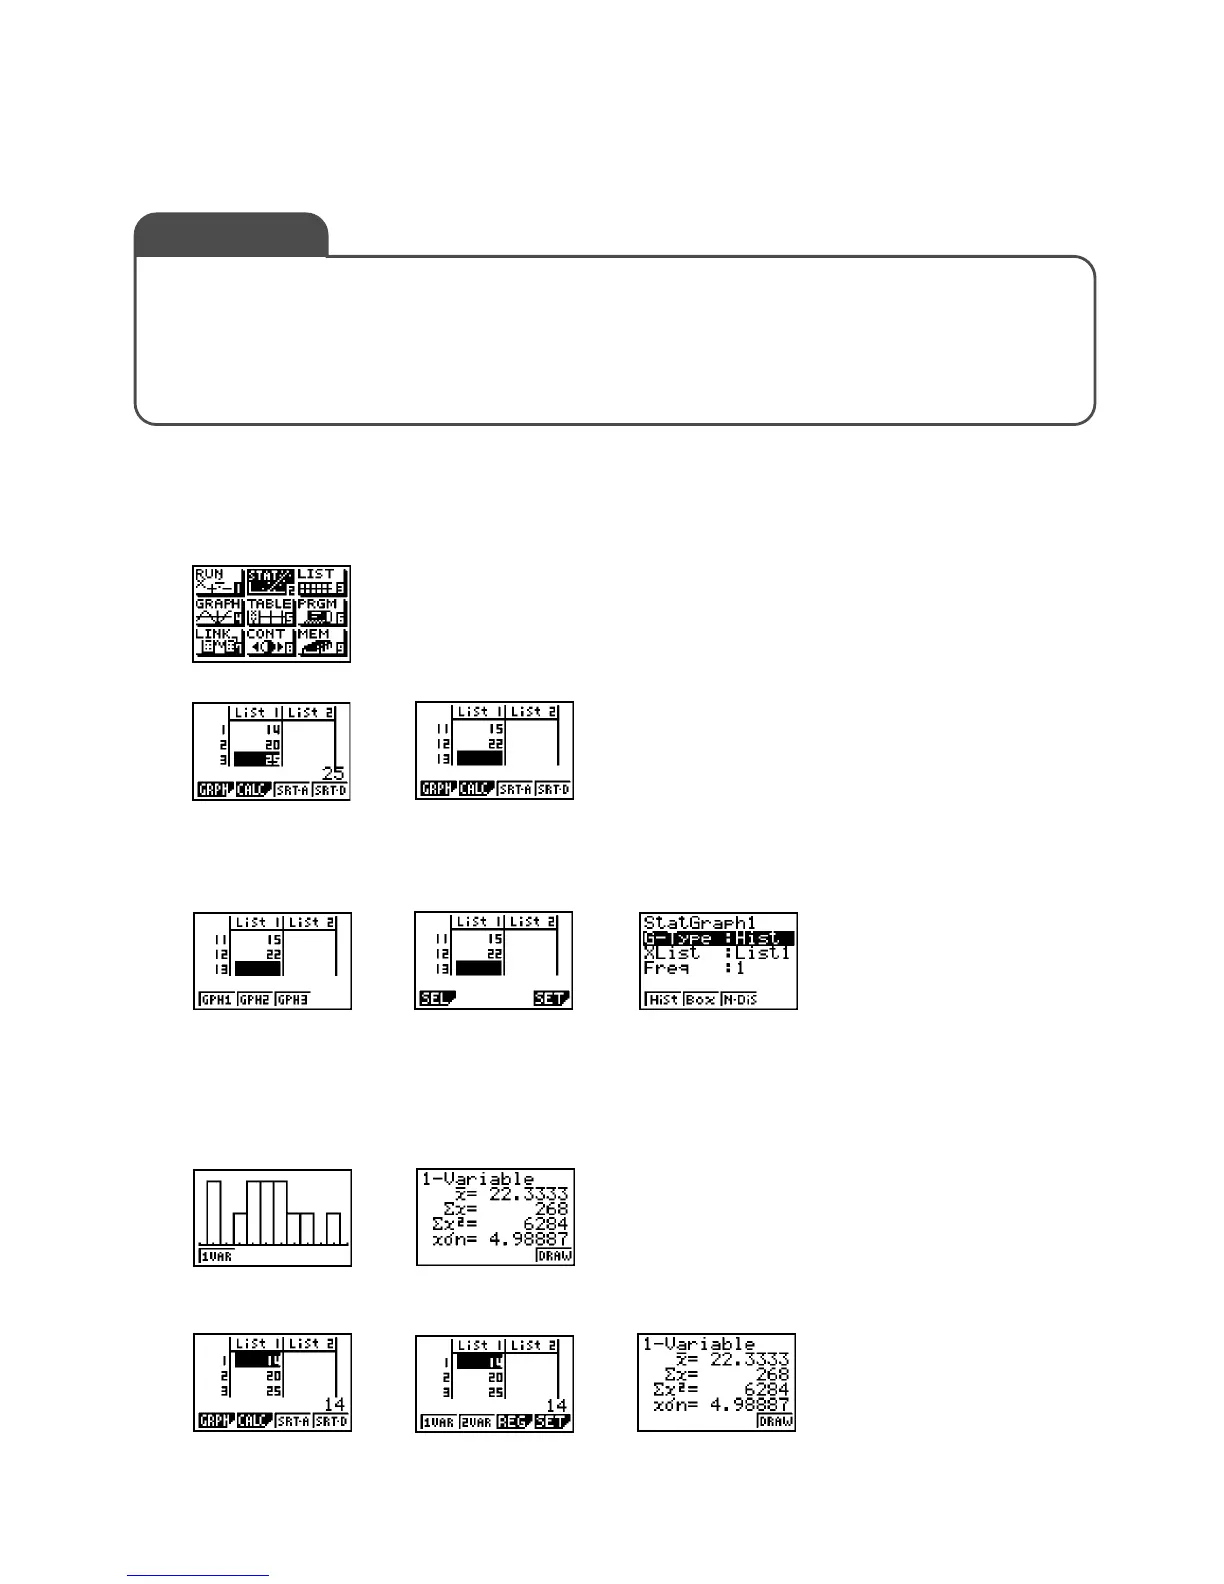
1. Input data into List 1.
2. Specify the data and graph.
3. This draws a histogram.
4. Pressing 2(CALC) calculates the mean and standard deviation of the input data.
The following data represents the distances a handball is thrown by 12 students.
14 20 25 28 18 26 (Unit: meters)
23 21 24 32 15 22
(The Entrance Examination of Hokkaido Public High School, 2000)
Press 1(GRPH) to display the
data and graph setting screen.
[
4(SET)
Configure settings as shown
above, and then press
w.
1(1VAR)
1(GPH1)
1(1VAR)
Exercise 1
Q
2(CALC)
*Select G-Type, and press
[, 1(Hist)

 Loading...


