– 60 –
Q-2 Component Quality Variation Control
(X-R Control Chart)
The X-R control chart is widely used to control variations in dimensions, quality, strength,
and other qualities. X is the mean value and R is the range, which is the difference
between the maximum and minimum values of a group of data. This data expresses
variance instead of standard deviation.
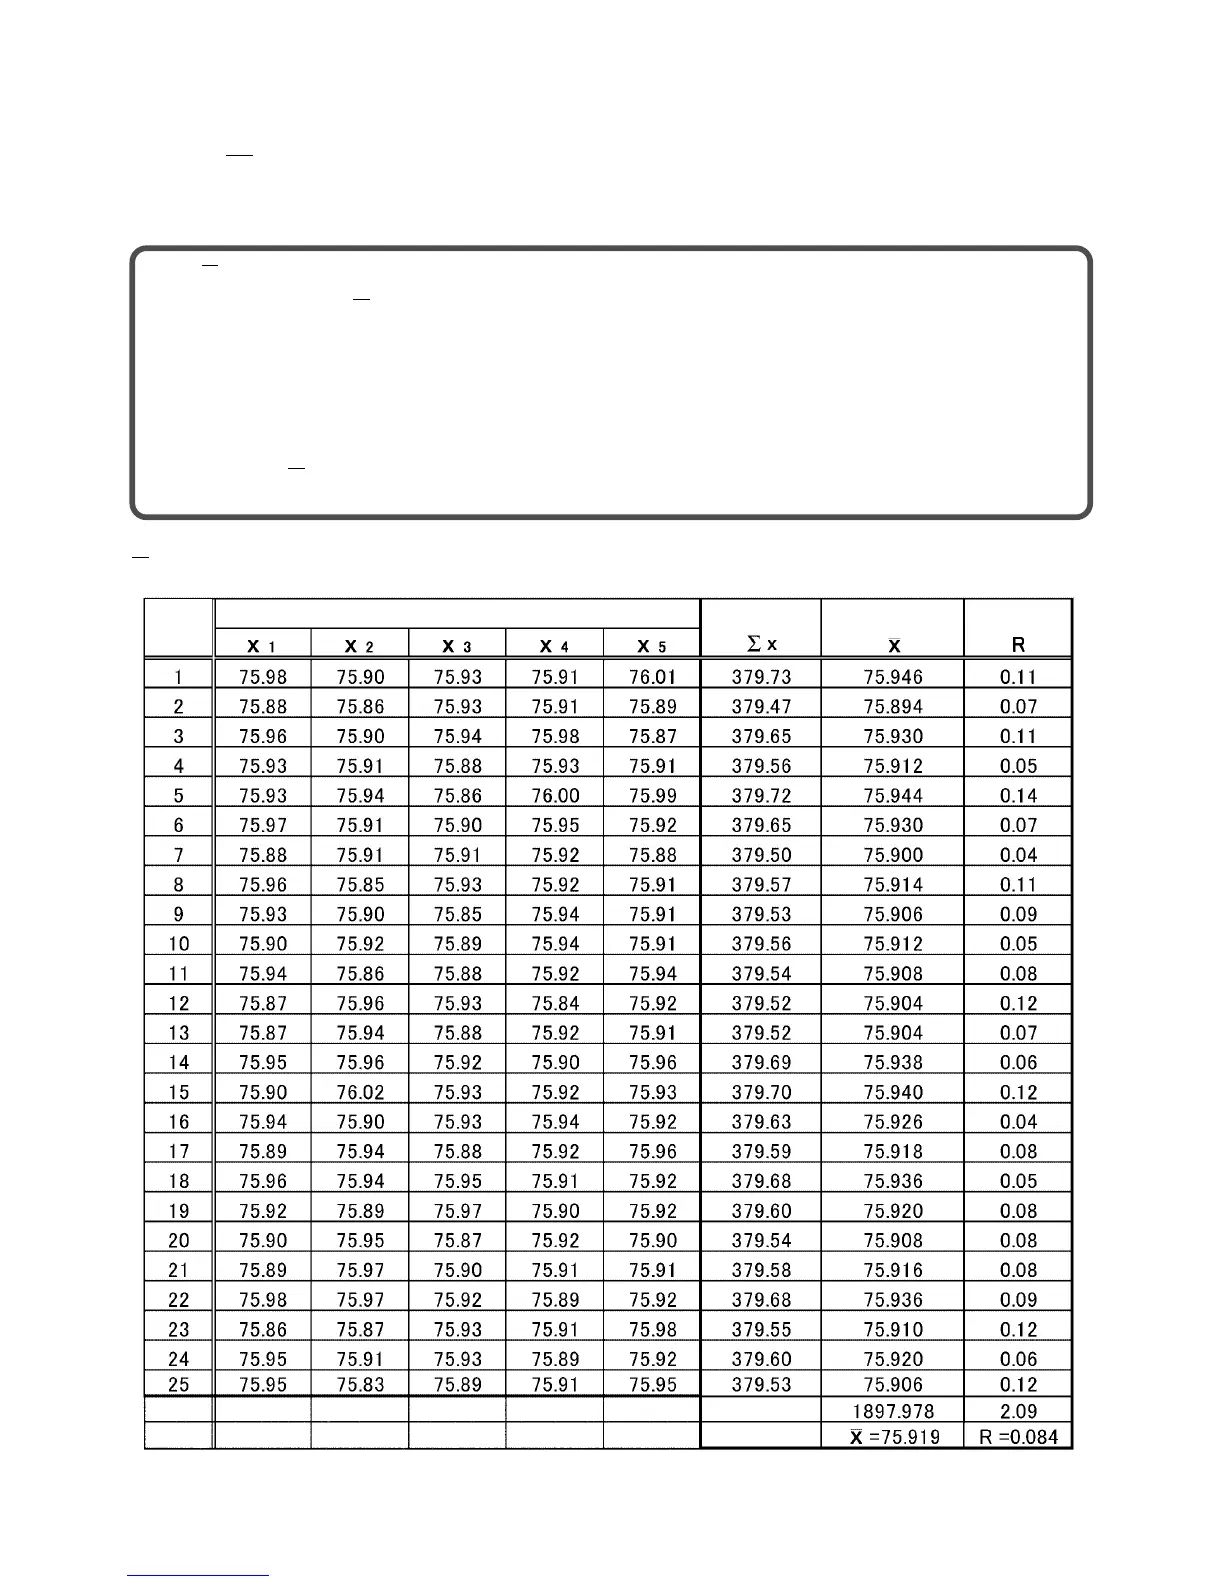
The data sheet below was created by selecting five items from each of 25 lots. The
diameter of each item was measured and recorded in the data sheet, which was then used
to create the X-R control chart.
X-R Control Chart Data Sheet (Example)
Group
Number
Measured Values [mm]
Total Mean Range
Total
JIKKYO SHUPPAN CO., LTD.: SHIN KIKAI KOSAKU 2

 Loading...


