– 61 –
Use the values in the data sheet to determine the mean (X) and range (R) for each of the data
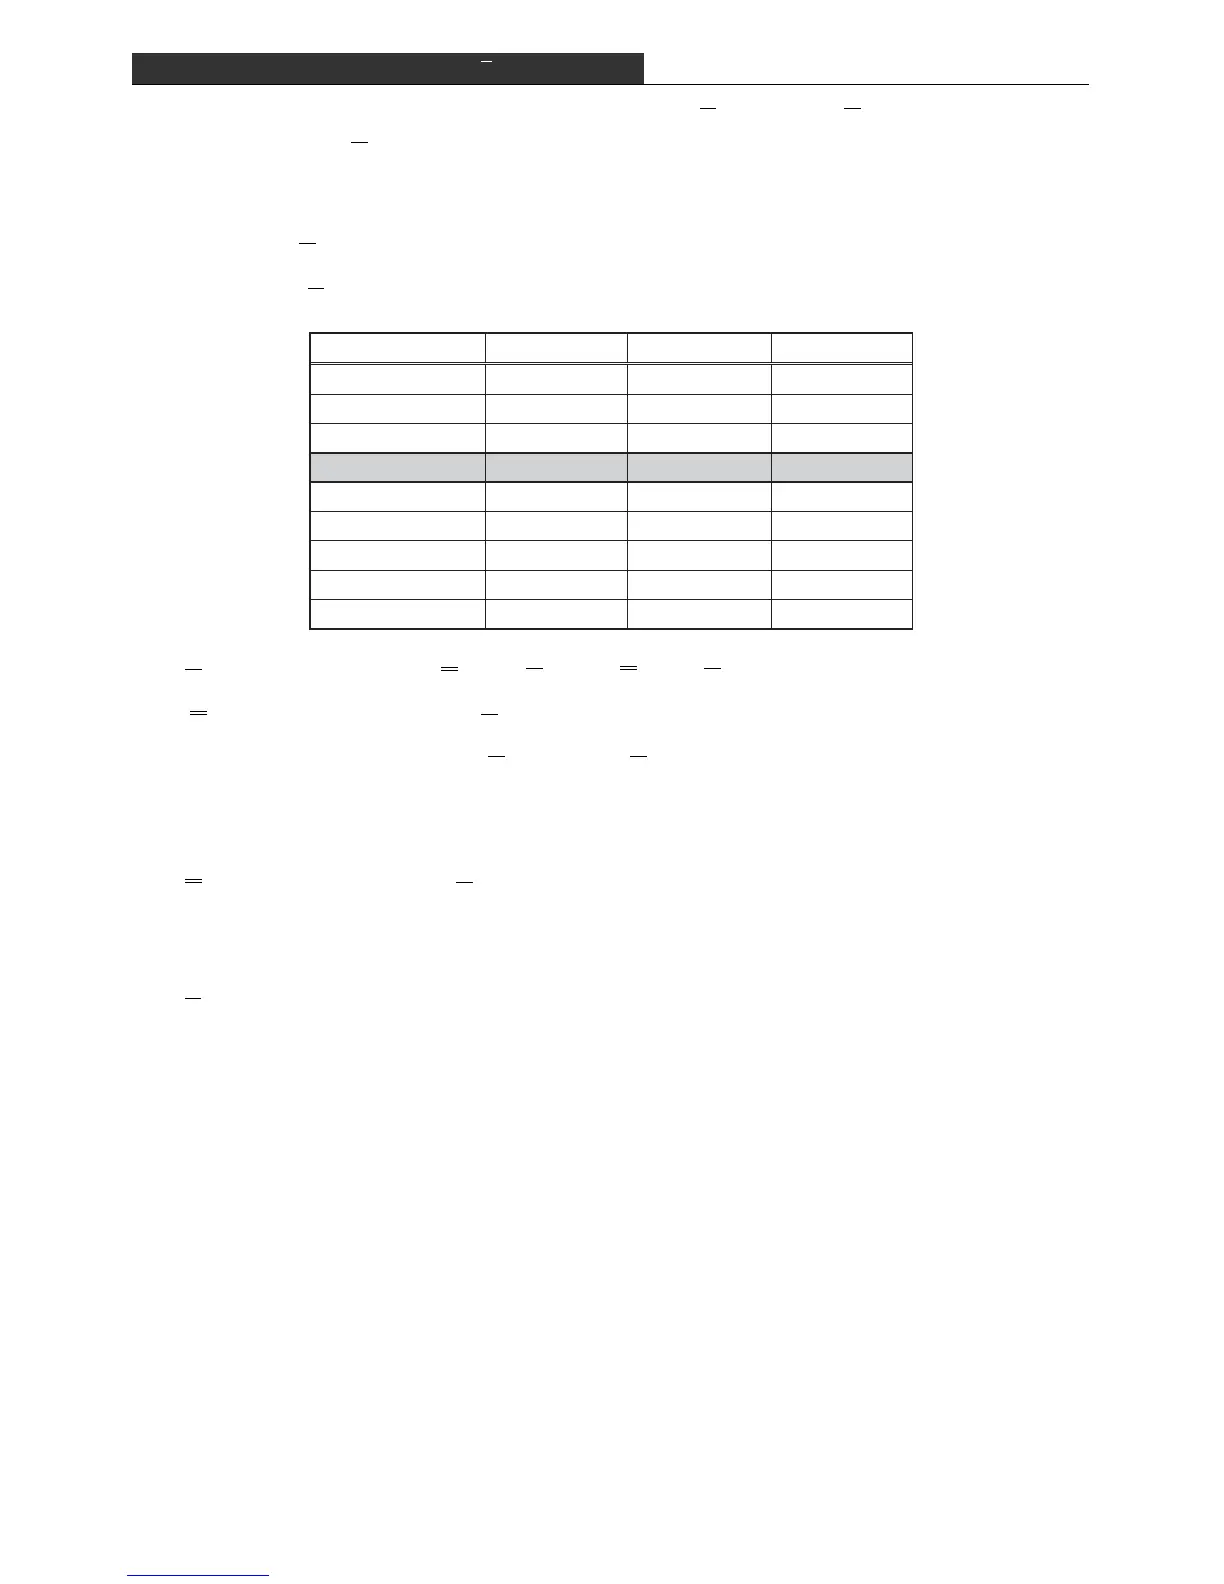
groups. Next, use the X control chart coefficient table below to determine the A2, D3, and D4
coefficients in accordance with the number of measured values in each group (sample size n).
Using these coefficients, determine the upper control limit (UCL) and lower control limit (LCL) for
the mean value (X) and range (R) as shown below, and create the control chart.
X Control Chart Coefficient Table
Q-2 Component Quality Variation Control (X-R Control Chart)
[Calculation]
X Control Chart UCL = X + A2 • R, LCL = X – A2 • R
*X is the mean of the mean values (X).
R Control Chart UCL = D4 • R, LCL = D3 • R
1897.978
X = ––––––––– = 75.919,
25
2.09
R = ––––– = 0.084
25
A2 = 0.58, D4 = 2.11 (For sample size n = 5).
X Control Chart UCL = 75.919 + 0.58 × 0.084 = 75.967
LCL = 75.919 – 0.58 × 0.084 = 75.870
R Control Chart UCL = 2.11 × 0.084 = 0.177
2
3
4
5
6
7
8
9
10
1.88
1.02
0.73
0.58
0.48
0.42
0.37
0.34
0.31
— — —
— — —
— — —
— — —
— — —
0.08
0.14
0.18
0.22
3.27
A
2
D
3
D
4
2.57
2.28
2.11
2.00
1.92
1.86
1.82
1.78
Sample Size n

 Loading...