– 37 –
EC-4 Solubility Curve
Industrial Chemistry (1) (Solubility Curve)
The nearby table shows the solubility of potassium nitrate KNO
3
in water. Use this to draw
the solubility curve of potassium nitrate.
Exercise
Graphic Calculator Operation
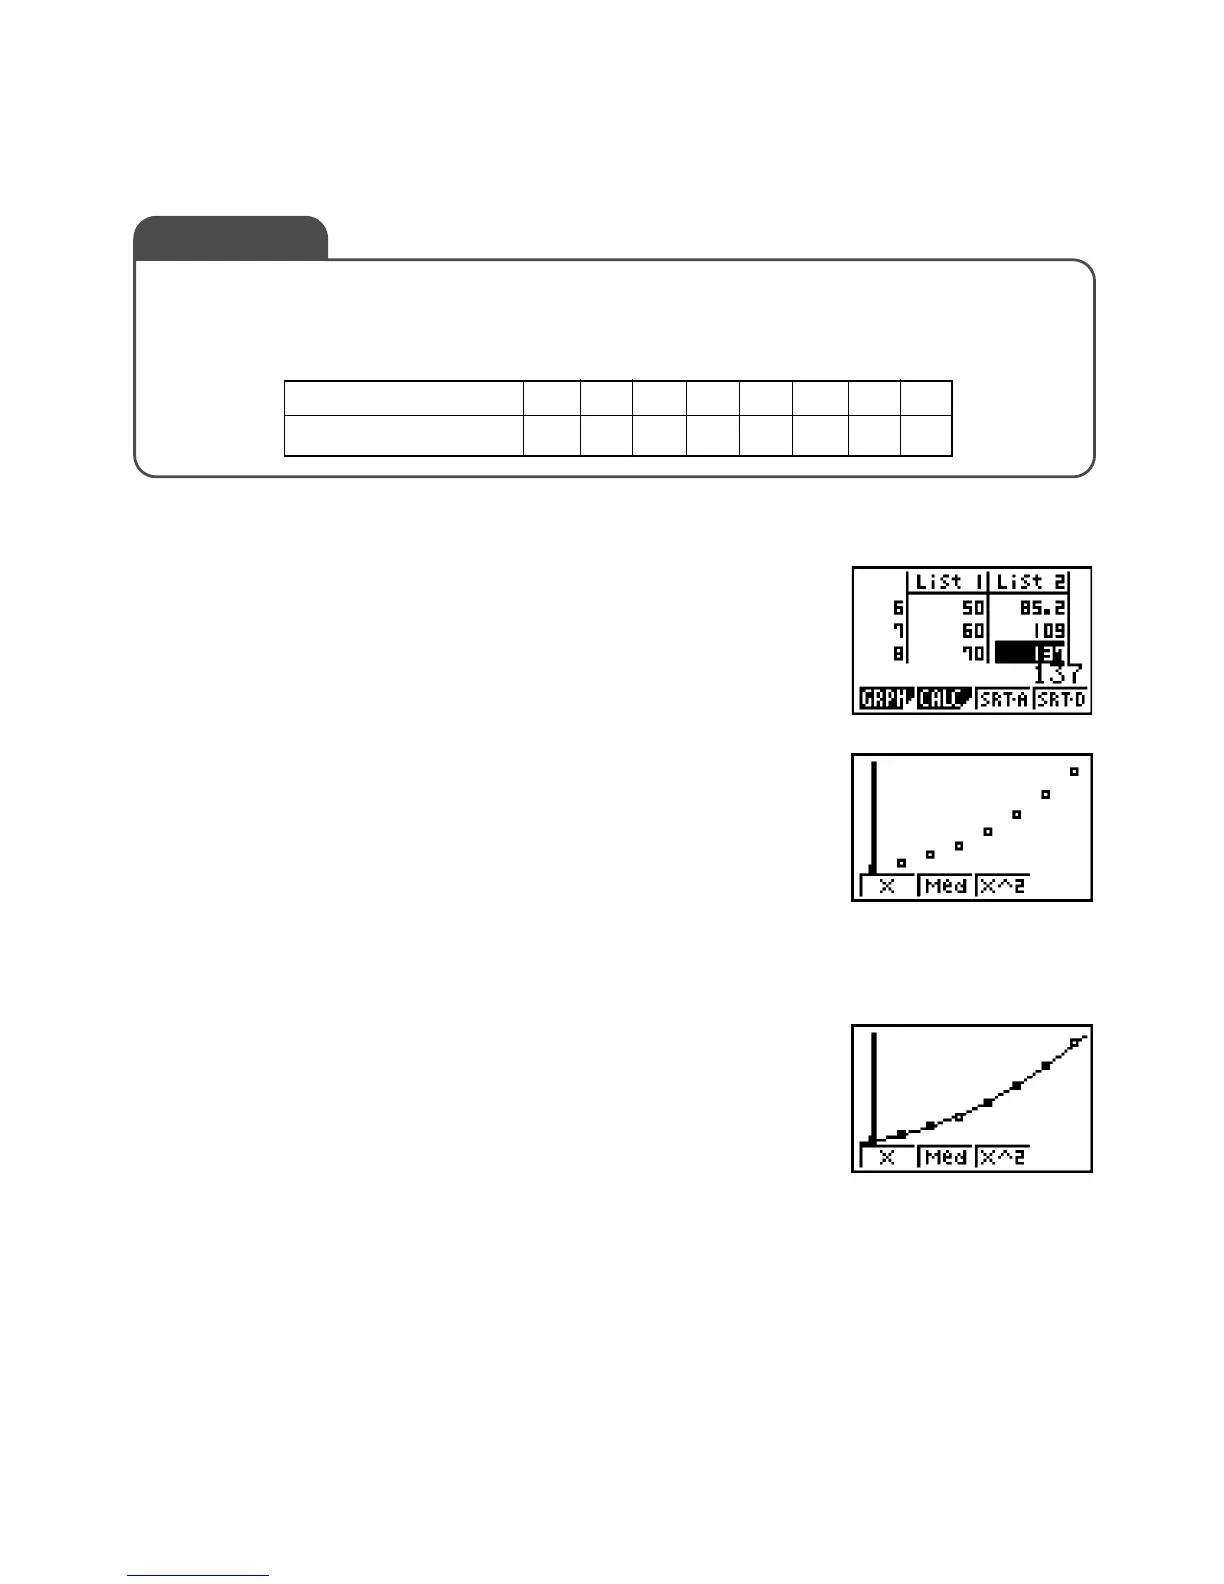
(1) From the Main Menu, enter the STAT Mode, input tem-
perature into List 1 and solubility into List 2.
(2) Scatter diagram
Pressing 1(GRPH)1(GPH1) to display the nearby
graph.
(3) Regression curve display
Press 3(X^2) to display the regression curve on the
range of second order points.
By displaying the graph...
• You can see the changes in the values.
• You can see how the solubility curve changes according to material.
• The regression curve makes it possible to estimate solubility for temperatures not
shown in the table and provides data for experiments.
Temperature (°C) 010203040506070
Solubility (g/100g water) 13.3 22.0 31.6 45.6 63.9 85.2 109 137
JIKKYO SHUPPAN CO., LTD.: KOGYO KAGAKU (p. 55)

 Loading...


