– 36 –
Results (Example)
Graphic Calculator Operation
3-1. Determination of Unknown Sample Density from Graph
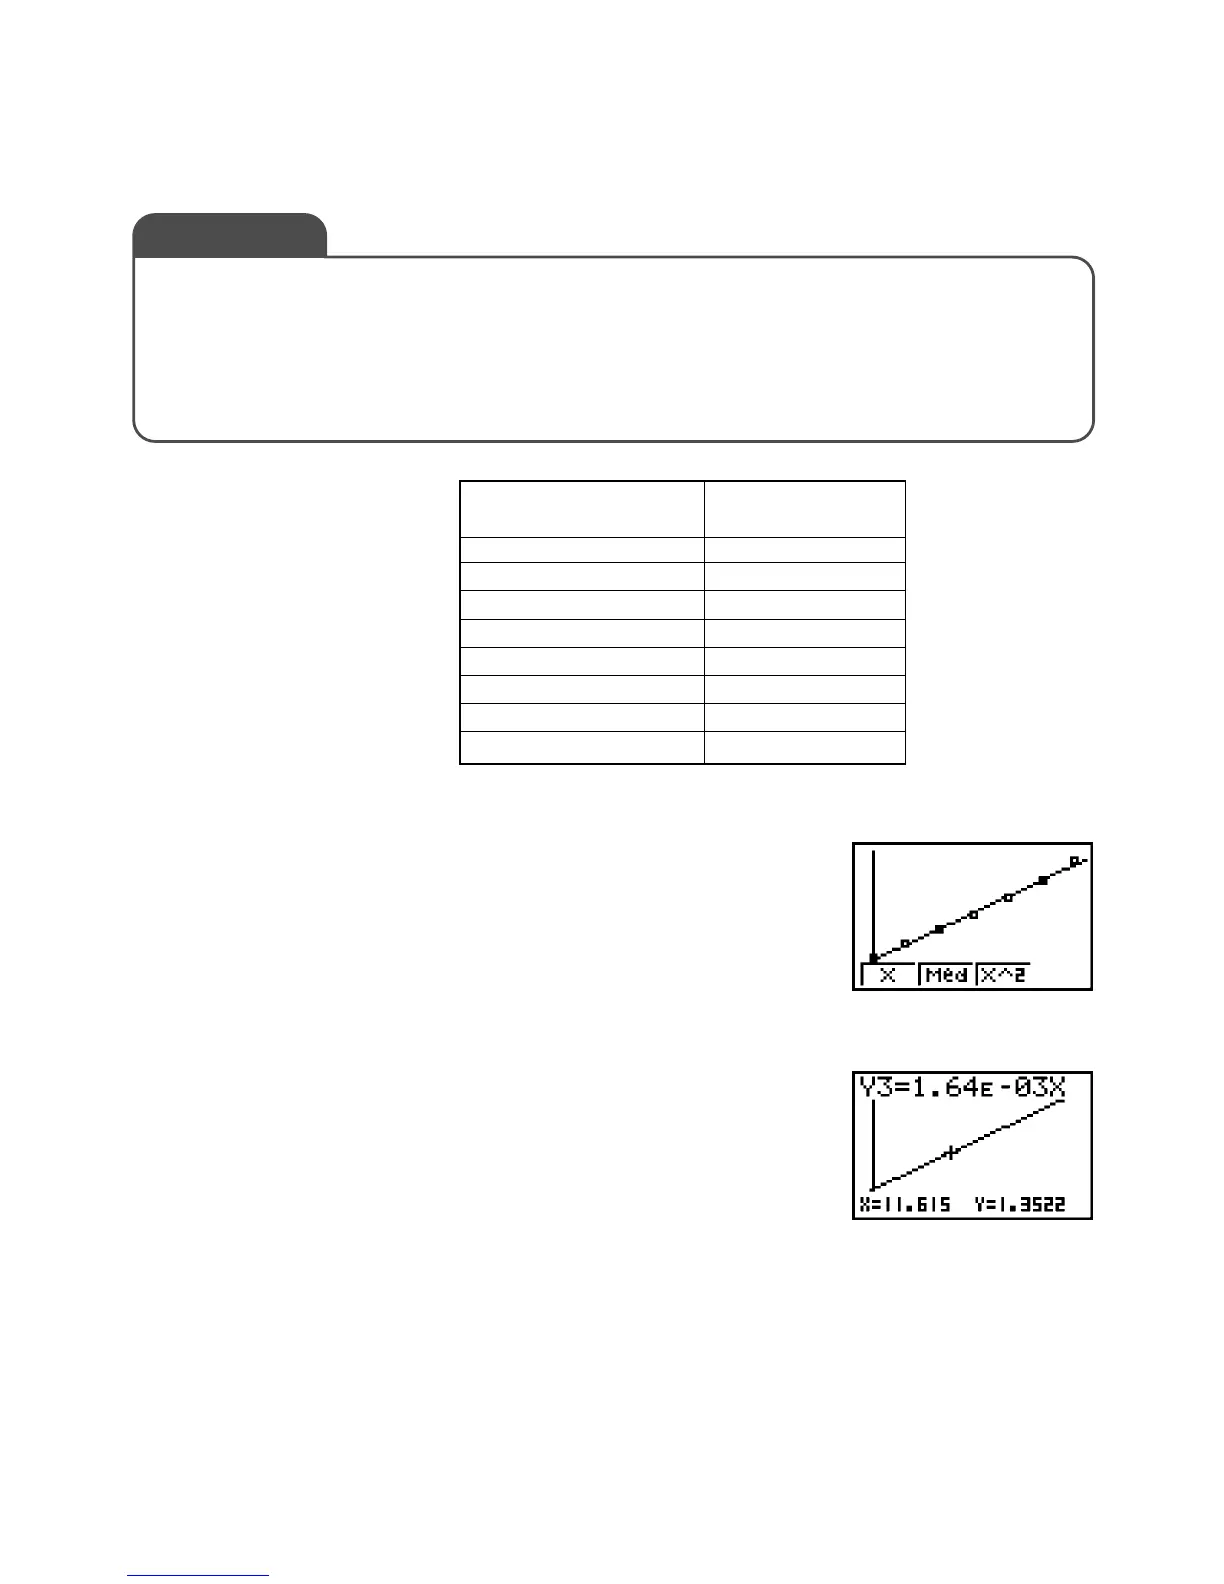
In the STAT Mode, display the measurement results, perform
linear regression, and then copy the regression graph to the
GRAPH menu.
Display the graph you copied to the GRAPH menu and deter-
mine the concentration for the unknown sample index of refrac-
tion 1.3521.
Display the graph and press !1(TRCE) to move the
cursor. The estimated value of Y when X is as close as possible
to 1.3521 (1.3522) is 11.615%.
EC-3 Index of Refraction of a Liquid
Measuring the Index of Refraction of a Liquid
Solutions are prepared with sucrose concentrations of 0 to 30 wt%. A refractometer is used
to measure the index of refraction for of each sample. A juice sample is also measured
using the same procedure, and then a graph is used to estimate the sugar concentration of
the juice.
Exercise
01.3340
51.3419
10 1.3492
15 1.3569
20 1.3650
25 1.3742
30 1.3839
Unknown Sample (Juice) 1.3521
Sucrose
Concentration (wt%)
Index of
Refraction

 Loading...


