– 53 –
AR-3 Concrete Mix Design (Circle Graph)
The materials produced by a concrete mix design are shown below.
Use a graphic scientific calculator to draw a graph of this mixture.
Exercise 3
25 7.5 5 50 41 183 311 0 761
Coarse
Aggregate
Maximum
Size
Slump
1065 25
Mixture Table
[mm][cm] [g/m
3
]
Air
Content
[ ] W
Fine
Aggregate
Ratio
Water/
Cement
Ratio
W/Cs/a
Unit Weight [kg/m
3
]
Water
C
Cement
F
Admixture
S
Fine
Aggregate
Coarse
Aggregate
G
Admixture
Agent
mm
mm
5 mm
40 mm
[ ] [ ]
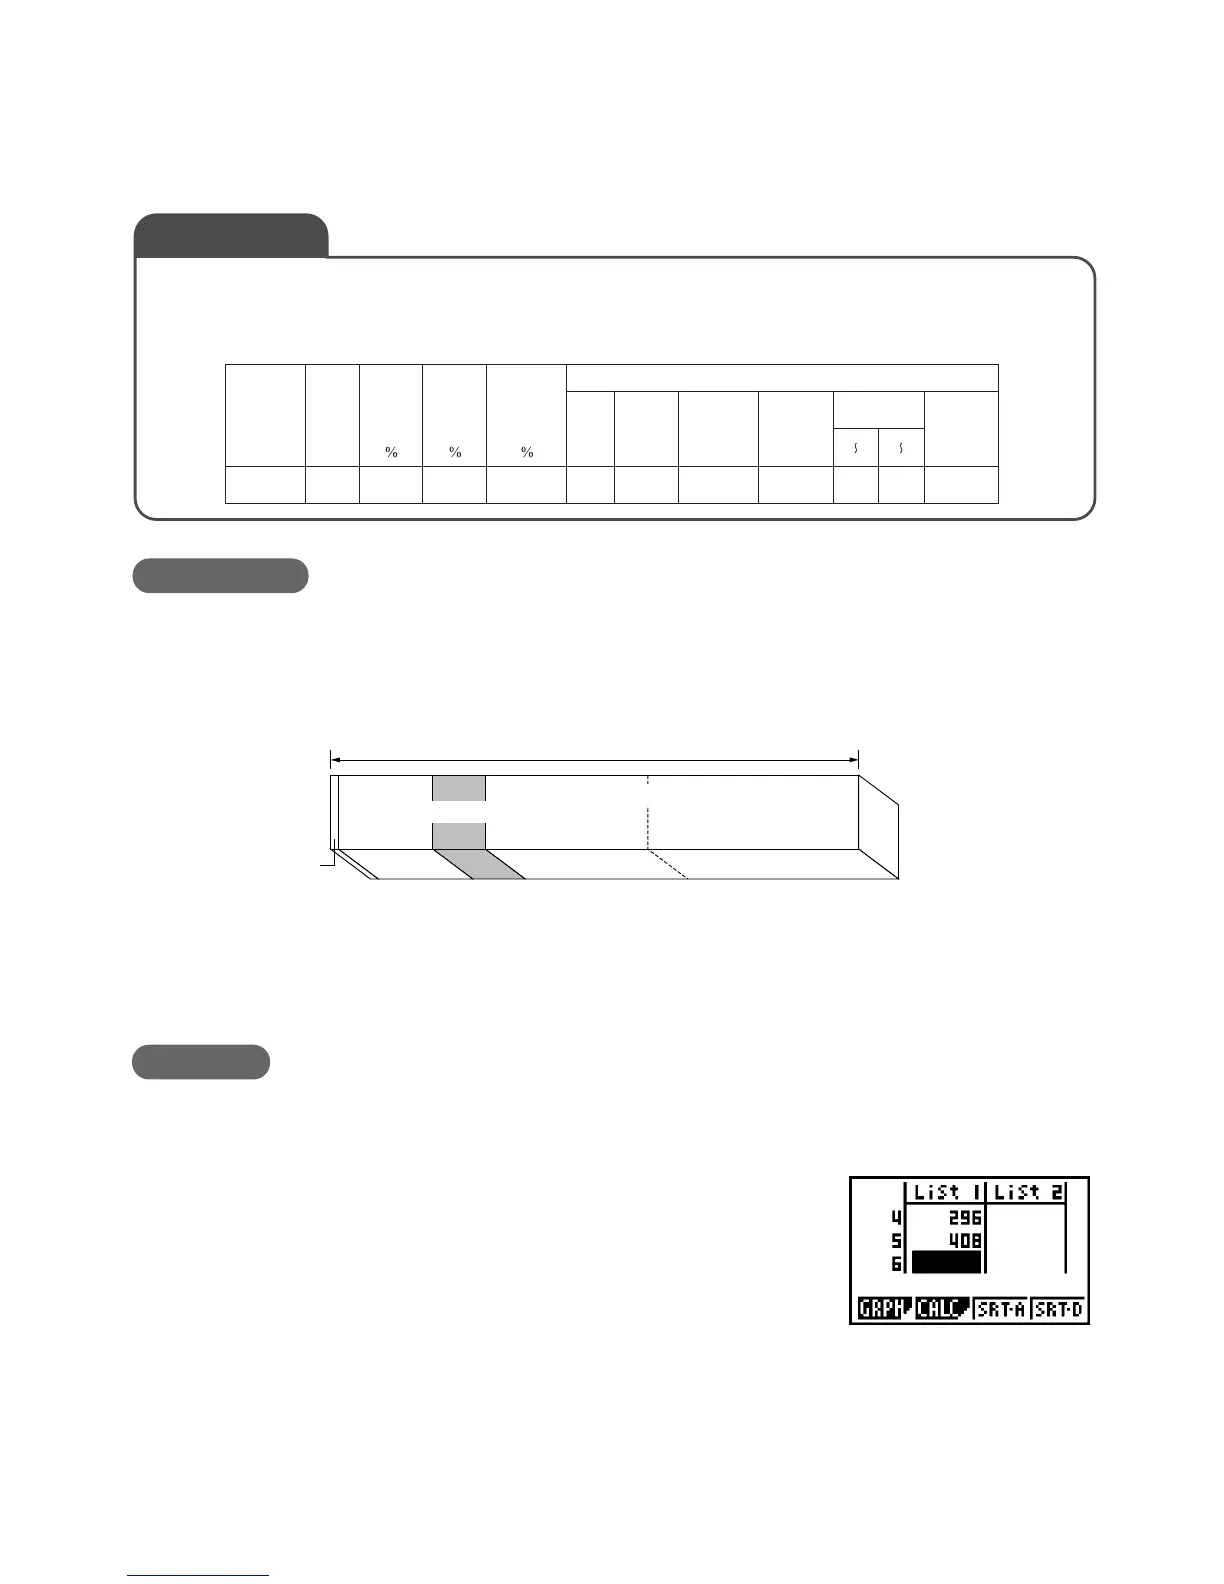
Creating a graph of concrete material unit weights provides a visual overview of percent-
ages of each material. The common way to do this is using a bar graph, like the one
shown below.
Unit Weight Sample Graph
The following operation uses a graphic calculator to produce a circle graph of the above
data.
uExpression Input
From the Main Menu, enter the STAT Mode.
After making sure the cursor is located in line 1 of
List 1, input the following data.
15w
183w
98w
296w
408w
Explanation
Operation
Concrete 1 m
3
(1000l)
Air
Water Cement
Aggregate
(Fine) (Coarse)
15 183
(183)
98
(311)
296
(761)
408
(1065)
[l]
[kg]

 Loading...


