– 19 –
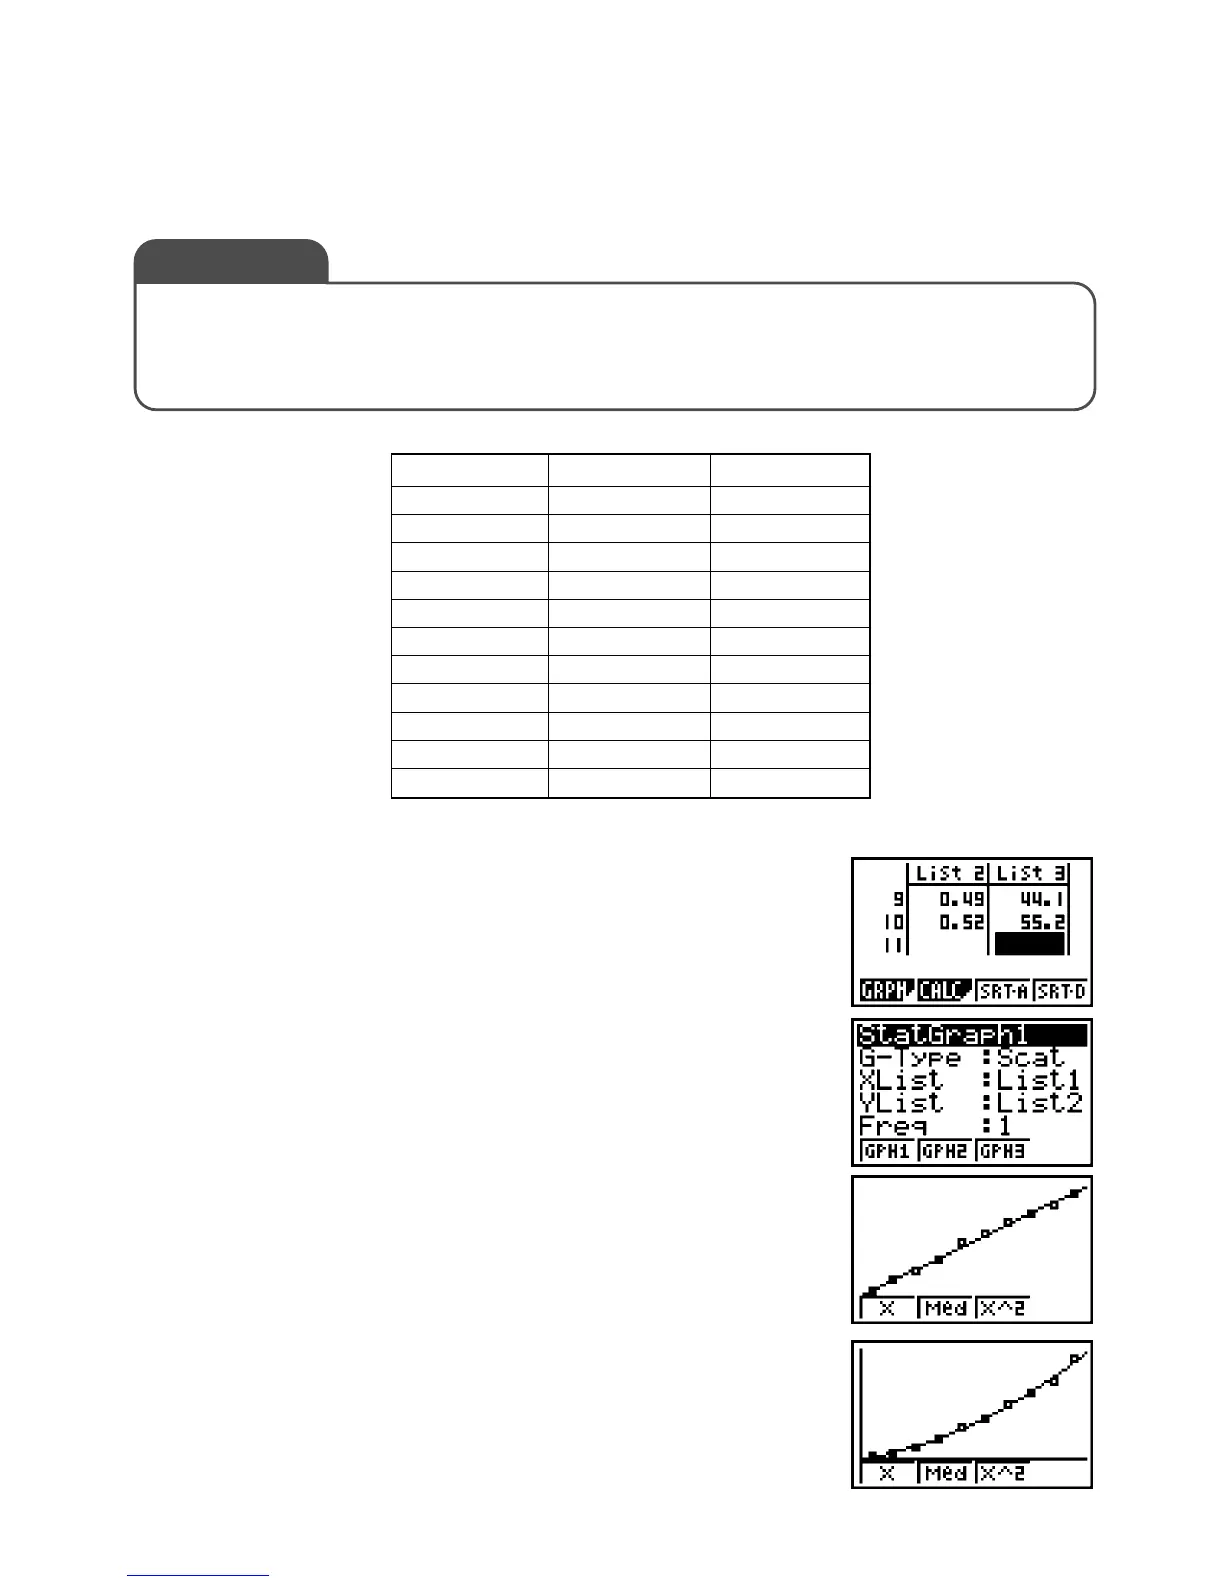
Voltage (V) Current (A) Power (W)
00 0
10 0.2 2.0
20 0.24 4.8
30 0.27 8.1
40 0.31 12.4
50 0.36 18.0
60 0.39 23.4
70 0.43 30.1
80 0.46 36.8
90 0.49 44.1
100 0.52 55.2
Measured Results
Graphic Calculator Operation
1. In the STAT Mode, input the data shown below.
List 1 = Voltage (V)
List 2 = Current (A)
List 3 = Power (W)
You do not need to input zeros as the initial values for
voltage, current, and power.
2. Voltage – Current
Make voltage (List 1) the XList, and current (List 2) the YList,
and then draw a regression curve. Then press 1(X) and
4(DRAW) .
The virtually straight line indicates a linear expression
(proportionality).
3. Voltage – Power
Graph voltage (List 1) for XList and power (List 3) for YList.
This line is curved, which means regression can be
performed using a range of points of second order.
(Press 3(X^2) and 4(DRAW) .)
EE-1 Relationship Between Voltage, Current, and
Power
Application 1
The following table shows voltage, current, and power measurements on a given circuit.
Draw a graph that shows the relationship among the three measurements.
Exercise

 Loading...


