– 15 –
S-2 Circle Graph
The data to the right shows the percent-
ages of new subscribers that use various
available methods to subscribe to an
Internet service provider. Draw a circle
graph of this data.
Solution
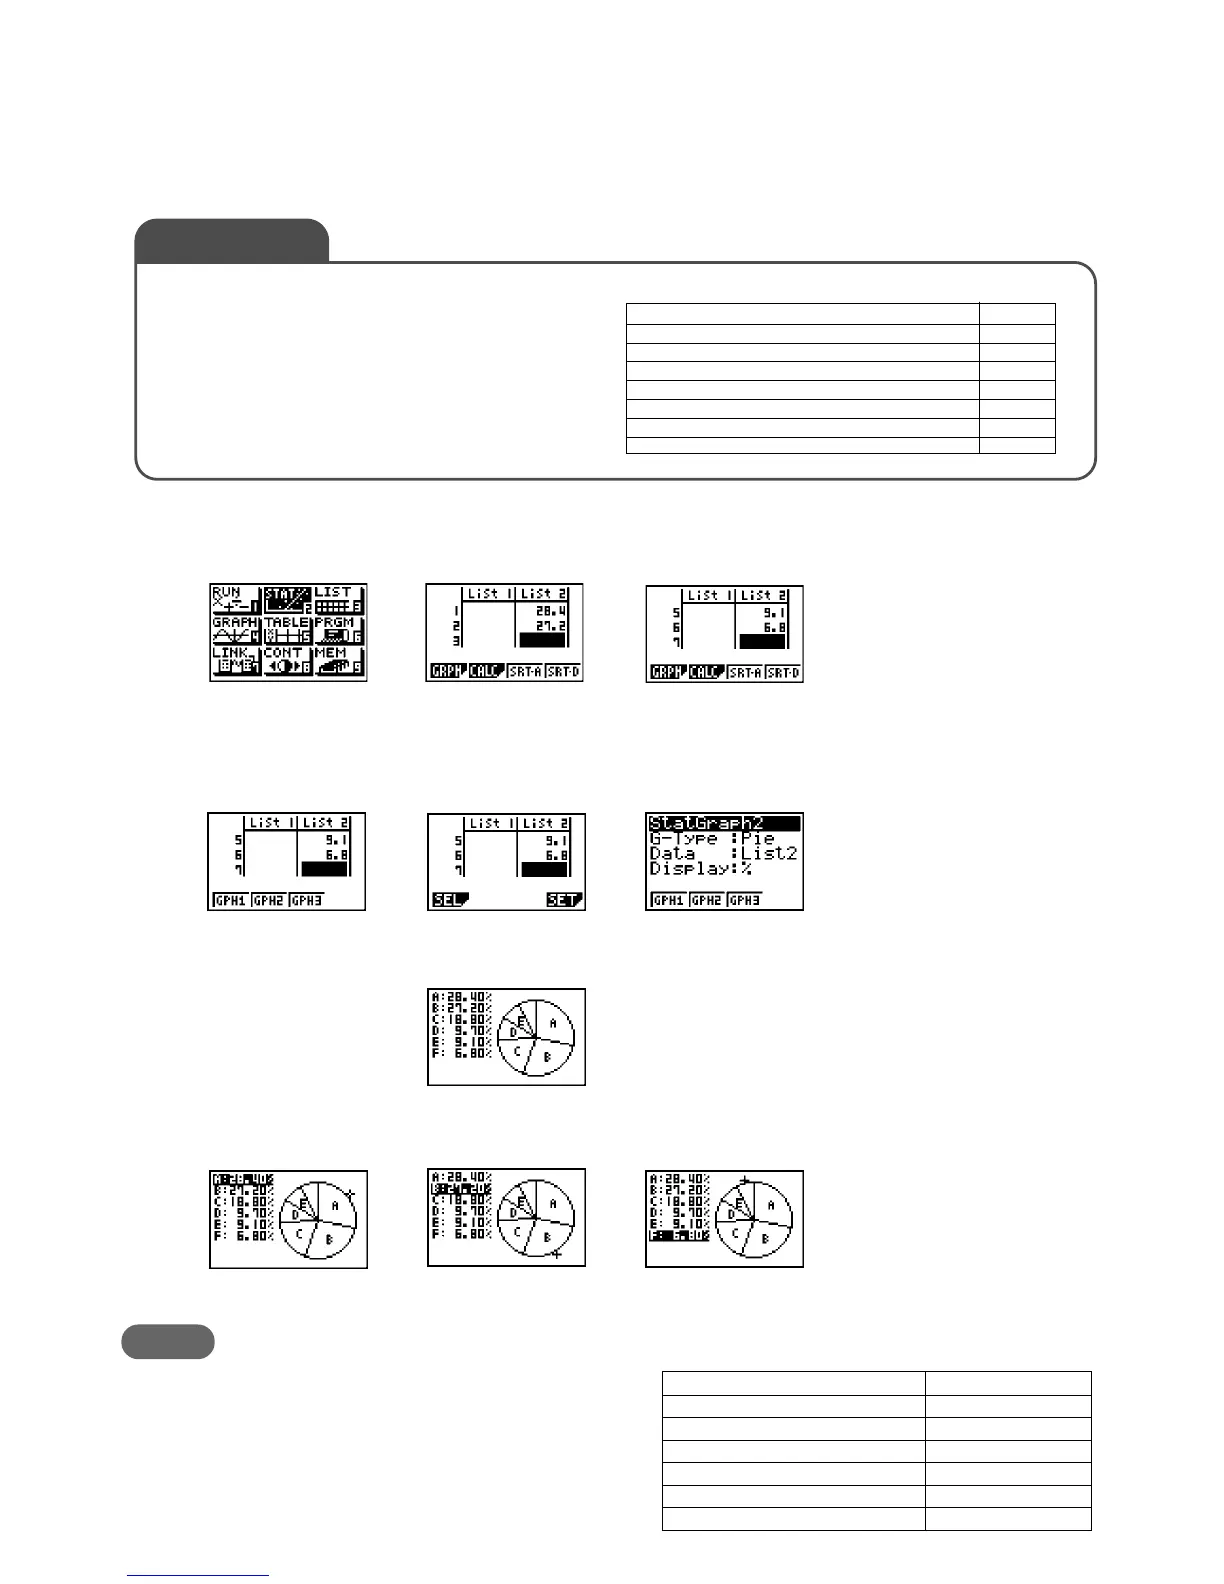
1. Input the data into List 2.
Set up the drawing conditions.
!m(SET UP)1(AUTO)Q
2. Select 1(GRPH).
Configure settings and press w.
3. Display the circle graph.
Press2(GPH2).
4. Use
1(TRCE).
Pressing the round cursor key
e
moves the pointer in the sequence A → B → C → D → E, and so on.
Drill 2
The nearby table shows Japanese lum-
ber production data by tree type. Create
a circle graph of this data. Note that the
values shown here are not percents.
Tree Type Volume
Japanese Cedar 7788
White Cedar 2338
Fir, Spruce 1609
Red Pine, Black Pine 1581
Larch 1526
Other 372
Unit: 1,000 mm
2
Lumber Production in Japan by Tree Type – 1988
Subscription Method %
From provider Website 28.4
Off-line by mail 27.2
Software that comes with new computer 18.8
CD-ROM provided through a magazine 9.7
CD-ROM distributed through retailers 9.1
CD-ROM requested from provider 6.8
Tota l 100
Users Employing Each Provider Subscription Method (%)
Exercise 2
This draws the circle graph.
(Yahoo! Internet Guide <2002. February>, Japan)
[
4(SET)

 Loading...


