– 14 –
Reference
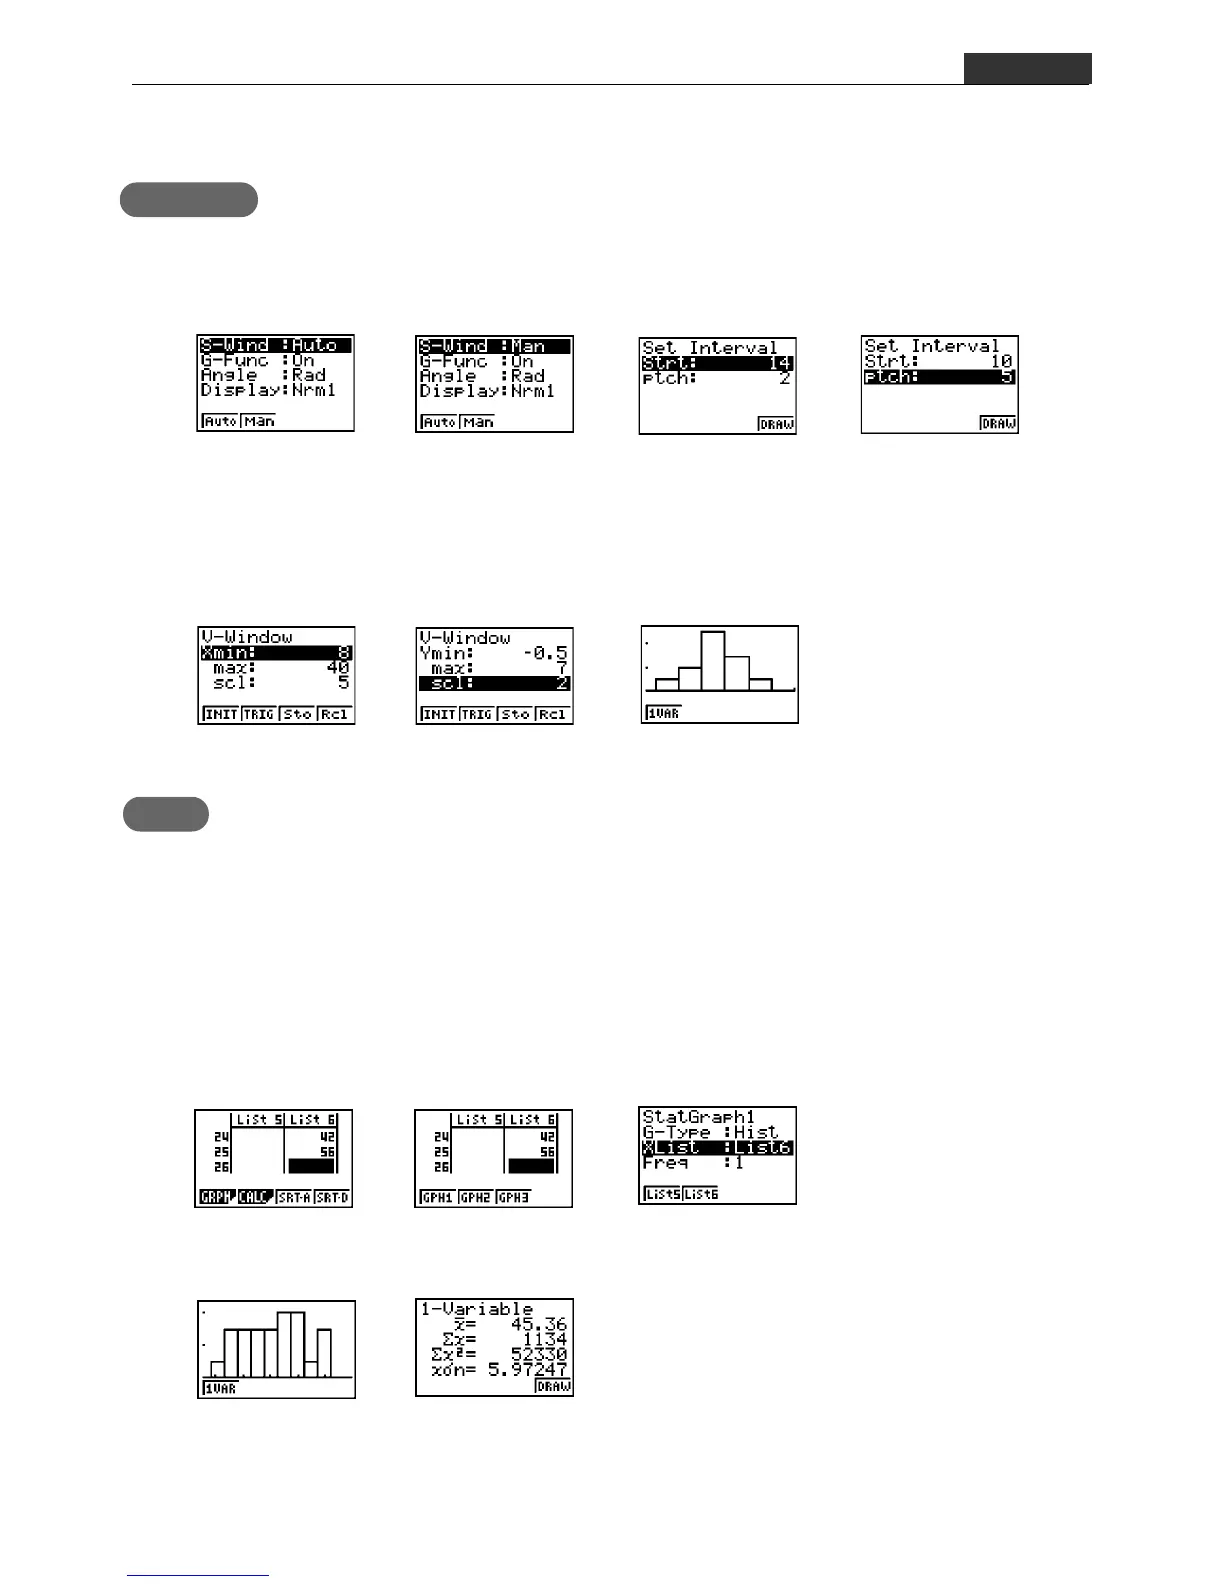
You can also change the width of the class.
Operation
(4) Draw the histogram.
w,1(GRPH),1(GPH1)
4(DRAW)
(1) !m(SET UP)
The display settings are also changed.
(3) !3(V-WIN)
x-axis
y-axis
Drill 1
The following shows the results recorded for a side step drill by 25 students. Use the
data to draw a histogram.
(The Entrance Examination of Yamaguchi Public High School, 2000)
55 34 47 54 39 48 44 37 44 49
43 40 51 38 43 49 38 45 53 39
51 47 48 42 56
Data Input Start
Abbreviated Solution
Input Complete
Data and Graph Type
Selection
Histogram Display Statistical Data
Q
(2) Change the start value of the class
to 10, and the width to 5.
w,1(GRPH),1(GPH1)
S-1 Histogram
S
10 w5 w
2(Man)
c
*Use List 6.

 Loading...


