– 55 –
1
2
3
4
5
6
7
8
9
10
11
12
13
14
15
16
17
18
19
20
21
22
23
24
Division Number
Diameter Range [mm]
Median
Frequency
Rod Diameter Measured Values
Measured Value
34.6
1
34.55~34.65
34.60
1
34.68
34.71
34.66
34.71
34.65
34.67
34.67
2
34.65~34.75
34.70
7
34.82
34.76
34.75
34.83
34.78
34.84
34.75
34.75
34.75
34.83
34.79
3
34.75~34.85
34.80
11
34.91
34.87
34.85
34.91
34.86
34.88
34.85
34.85
34.89
34.91
34.87
34.94
34.94
34.86
34.89
34.85
34.86
4
34.85~34.95
34.90
17
34.96
35.02
35.03
35.02
35.04
35.01
35
34.95
35
35.01
35.02
34.99
34.97
34.99
35.02
34.97
34.98
35.03
34.98
34.96
35.04
35
34.97
35.03
5
34.95~35.05
35.00
24
35.06
35.08
35.08
35.14
35.11
35.05
35.07
35.13
35.1
35.11
35.08
35.09
35.05
35.13
35.05
35.1
35.1
35.07
35.09
35.08
6
35.05~35.15
35.10
20
35.22
35.18
35.21
35.2
35.15
35.18
35.15
35.19
35.21
35.19
35.2
35.17
7
35.15~35.25
35.20
12
35.32
35.32
35.34
35.28
35.34
35.25
8
35.25~35.35
35.30
6
35.36
35.35
9
35.35~35.45
35.40
2
100
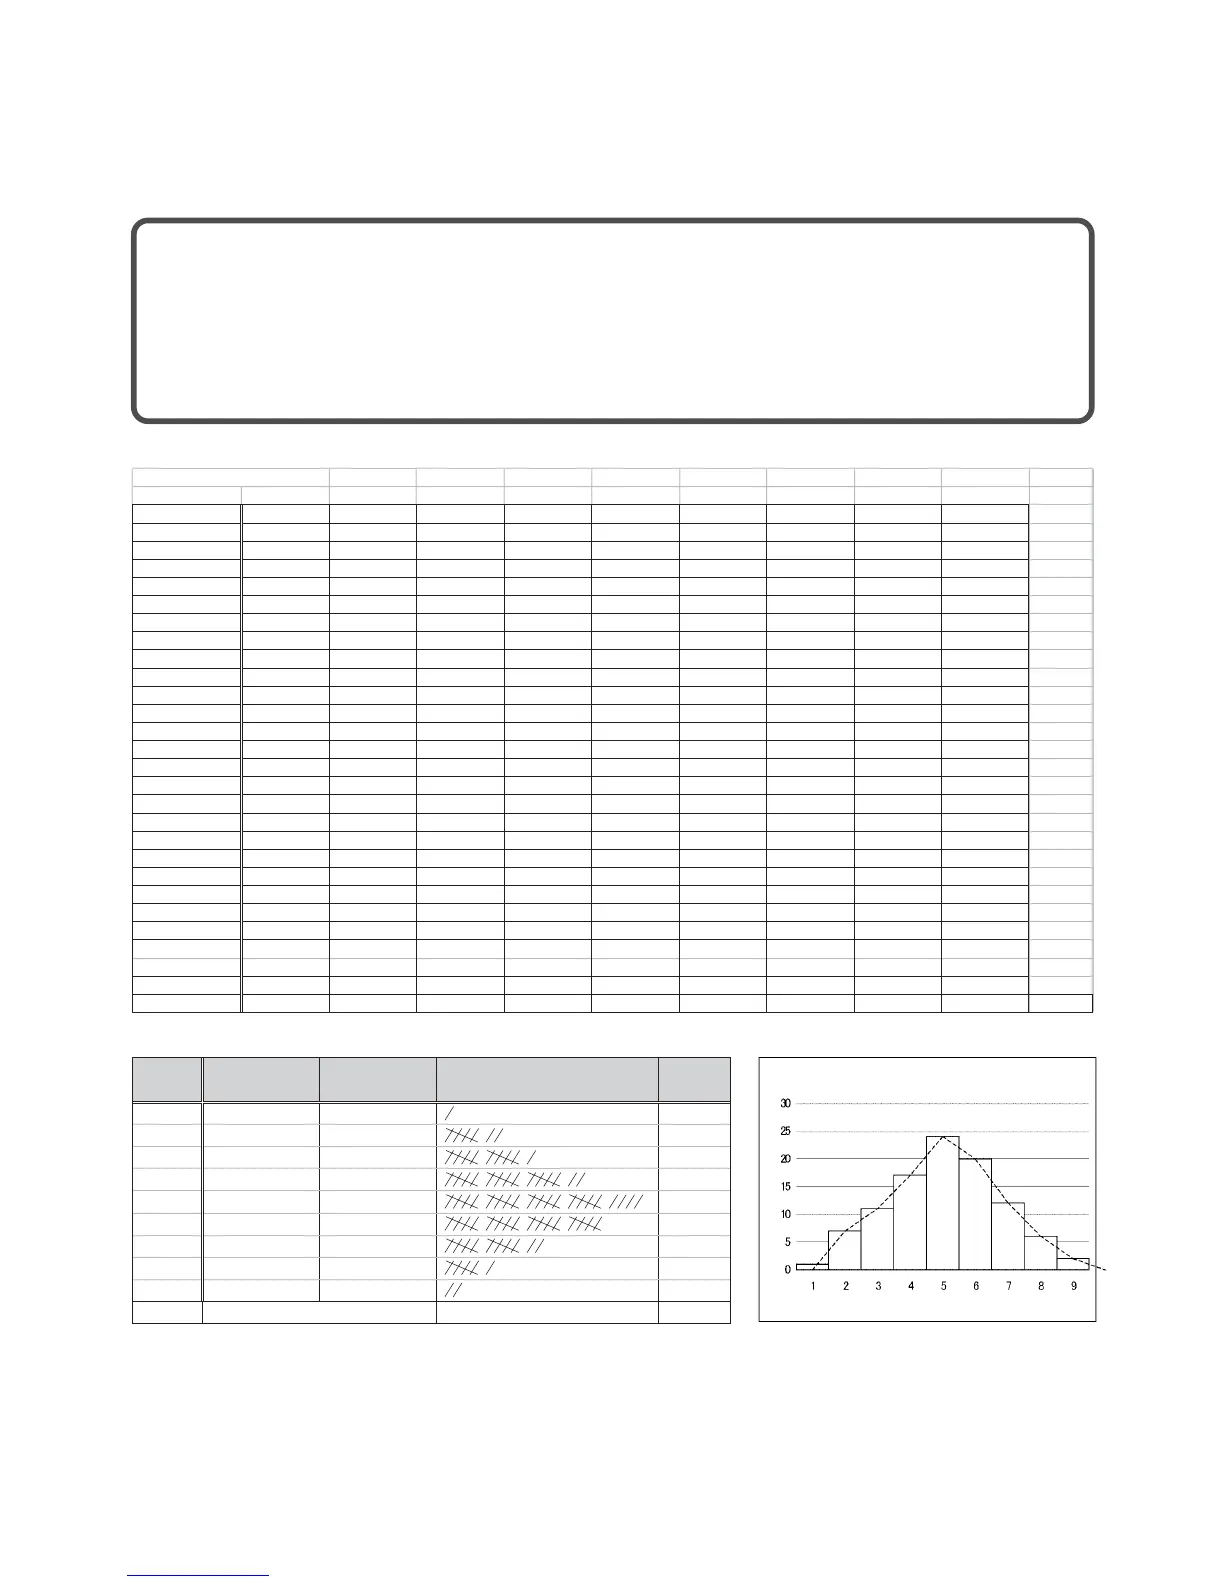
Q-1 Material Quality Control (Histogram)
Measurement of the diameters of 100 round rods that were to have been shaved to a diam-
eter of 35 mm revealed variation ranging from 34.55 to 35.45. Measurements were divided
into a number of ranges, which revealed the frequency distribution table shown below.
This data was used to create a bar graph histogram showing the frequency of the measured
values, combined with a distribution curve based on the median of each division.
Median [mm] Frequency Count Frequency
Diameter
Range [mm]
Division
Numbers
1
2
3
4
5
6
7
8
9
1
7
11
17
24
20
12
6
2
100
34.55~34.65
34.65~34.75
34.75~34.85
34.85~34.95
34.95~35.05
35.05~35.15
35.15~35.25
35.25~35.35
35.35~35.45
34.60
34.70
34.80
34.90
35.00
35.10
35.20
35.30
35.40
To ta l
Frequency Distribution Table
Diameter [mm]
Histogram
Frequency
JIKKYO SHUPPAN CO., LTD.: SHIN KIKAI KOSAKU 2

 Loading...


