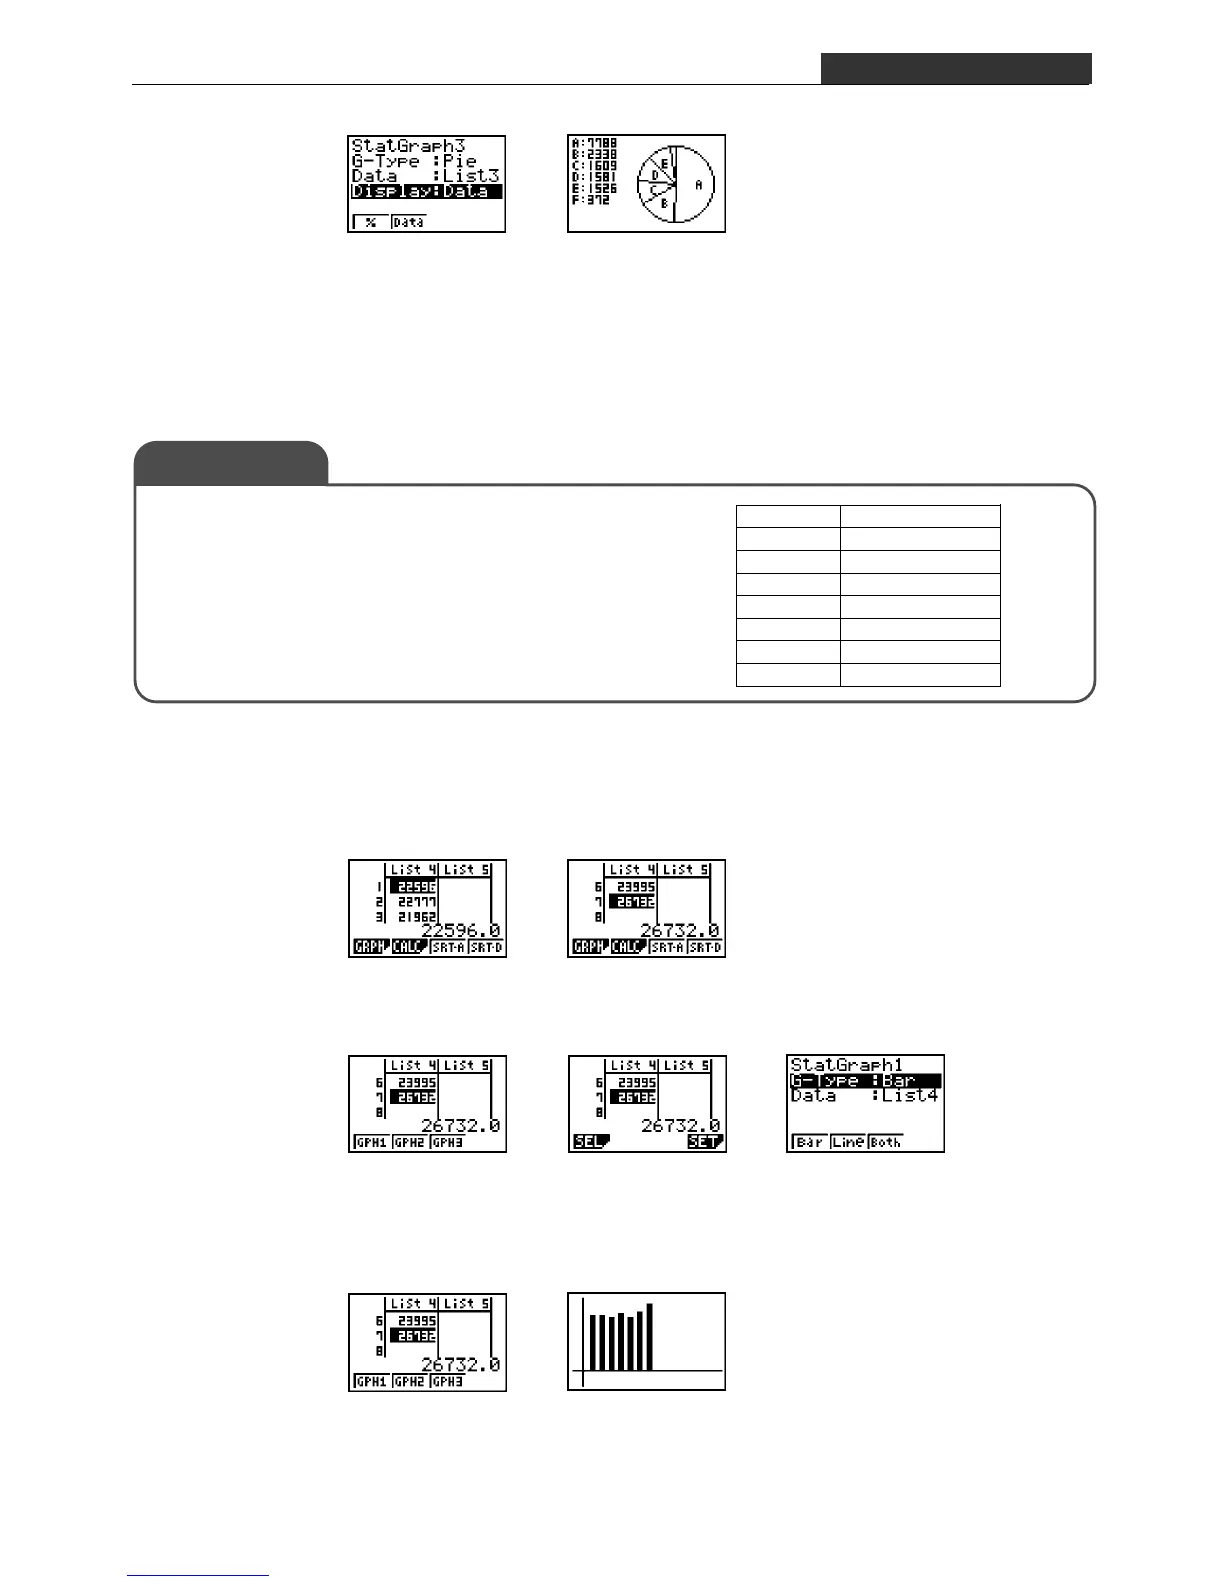
EasyManuals Logo

Casio fx-7400G PLUS Booklet

Casio fx-7400G PLUS
78 pages
To Next Page IconTo Next Page
To Previous Page IconTo Previous Page
Page #19 background imageLoading...
Page #19 background image
– 16 –
S-3 Bar Graph
The nearby table shows the number of people visiting
Hawaii from Japan and other countries during June
2000. It shows the total number of visitors on each day
of the week.
Drill 2 Solution
Note the setting for
Display.
Explanation: Input the data into List 4 and draw a bar graph.
Solution
1. Input the data into List 4.
2. Press 1(GRPH) and configure settings.
3. Display the bar graph.
[ 4(SET)
Configure settings as shown
above, and then press
w.
Press 1(GPH1) to select Graph 1.
Day Total Visitors
SUN 22596
MON 22777
TUE 21962
WED 23481
THU 21662
FRI 23995
SAT 26732
Exercise 3
S-2 Circle Graph S-3 Bar Graph

Other manuals for Casio fx-7400G PLUS

Questions and Answers:

Question and Answer IconNeed help?

Do you have a question about the Casio fx-7400G PLUS and is the answer not in the manual?

Casio fx-7400G PLUS Specifications

General IconGeneral
Modelfx-7400G PLUS
CategoryGraphing Calculator
DisplayLCD
Display Lines8
Display Characters21
Memory28 KB
Power SupplyBattery
ProgrammingYes
GraphingYes
Equation SolverYes
Statistical FunctionsYes
ConnectivityNo
BatteryAAA x 4

Related product manuals