– 52 –
•
Graph Settings
Configure settings for the X-axis and Y-axis ranges and
scales.
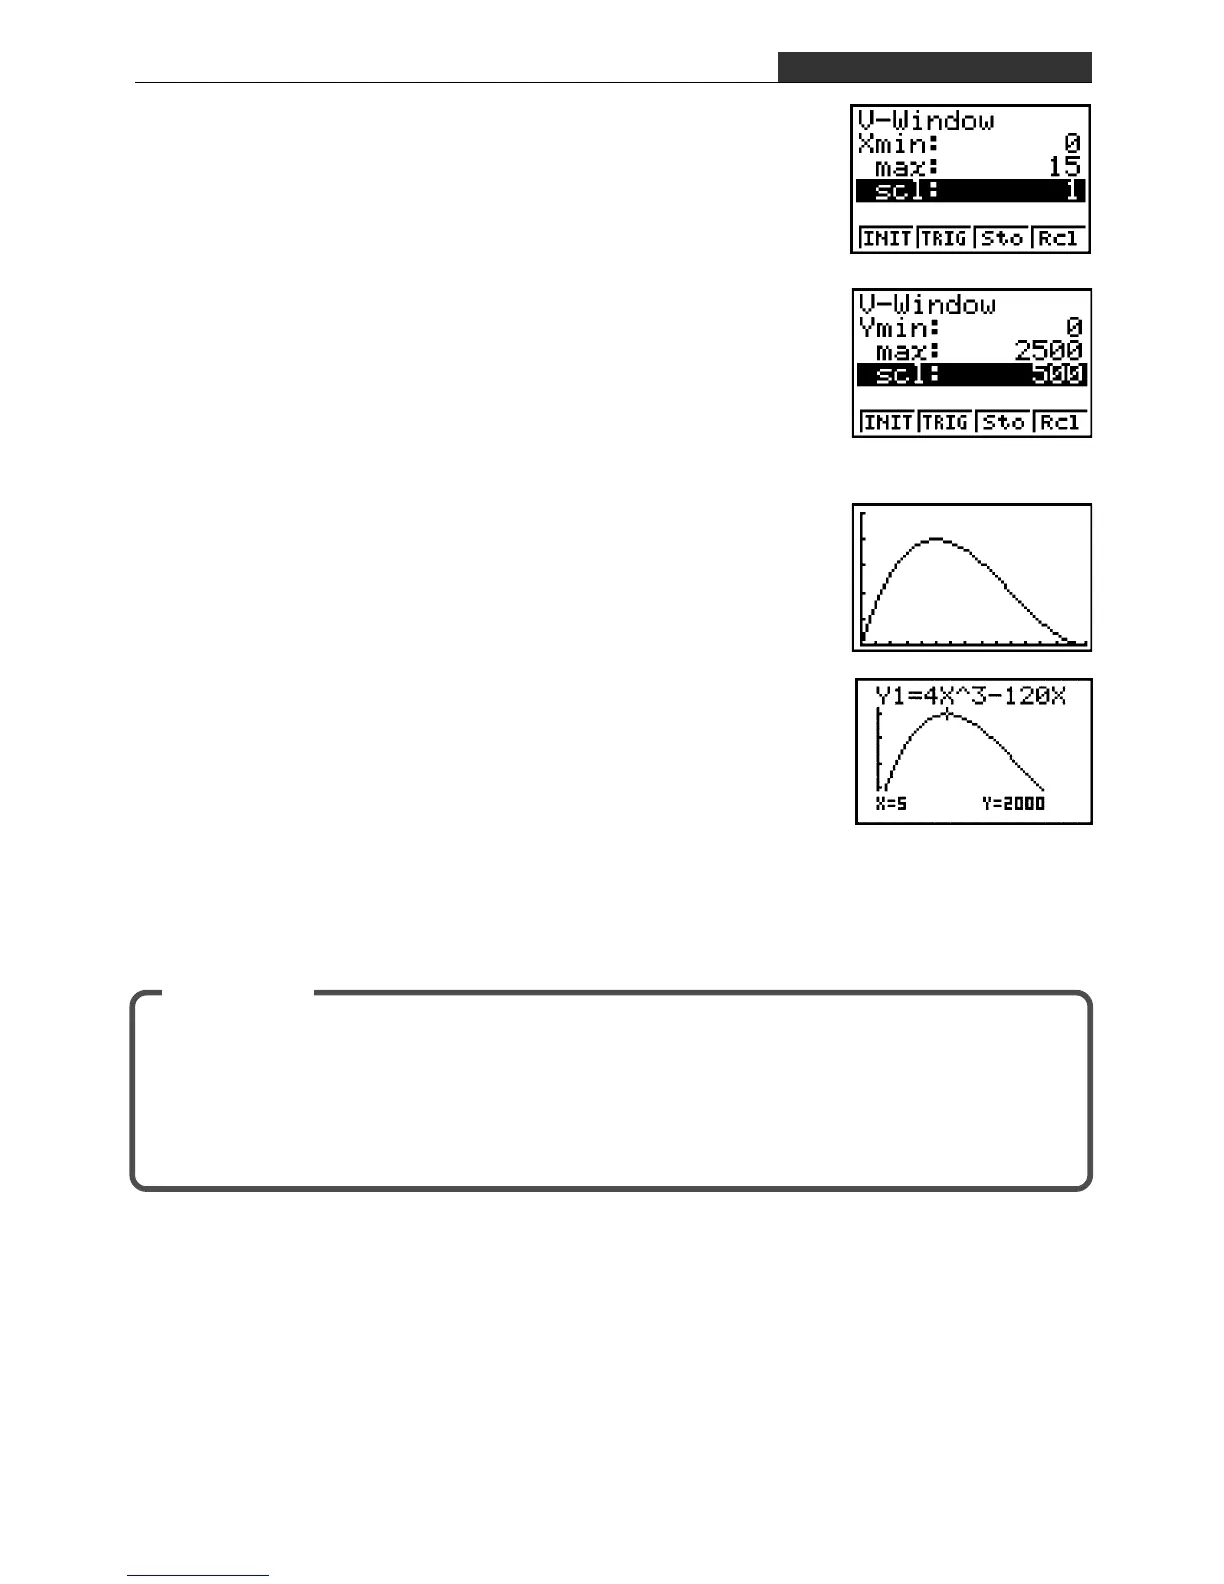
View Window Settings
Input the X-axis range and scale values shown on the screen
nearby.
!3 (V-WIN) 0 w15 w1 w
Next, input the Y-axis range and scale values.
c 0 w2500 w500 ww
•
Graphing
Press 4 (DRAW) to select DRAW.
This displays a graph like the one shown nearby.
•
Trace
Use trace to find out the maximum value.
!1 (TRCE)
Moving the cursor to the apex of the curve reveals that y =
2000, the maximum value, when x = 5.
This exercise shows that the volume of the box depends on the size of the cut out squares.
You can determine the best size for the cuts by observing where on the X-axis the maximum
value of Y is reached.
Check the V and x range settings before performing the operation.
Summary
AR-2 Economy of Materials (Volume)

 Loading...


