– 62 –
Q-2 Component Quality Variation Control (X-R Control Chart)
Using the STAT function of the graphic calculator, input the lot numbers and measured values
into lists, calculate the mean and range, and then graph the results using the statistical graph
function.
The actual operation of the calculator is shown below.
Calculator key operations and displays are indicated
inside the broken line box.
dfec indicate cursor key operations.
[ indicates the far right function key (next to 4).
Note
w key
o key
Cursor key
Function key
(1 to 4, [)
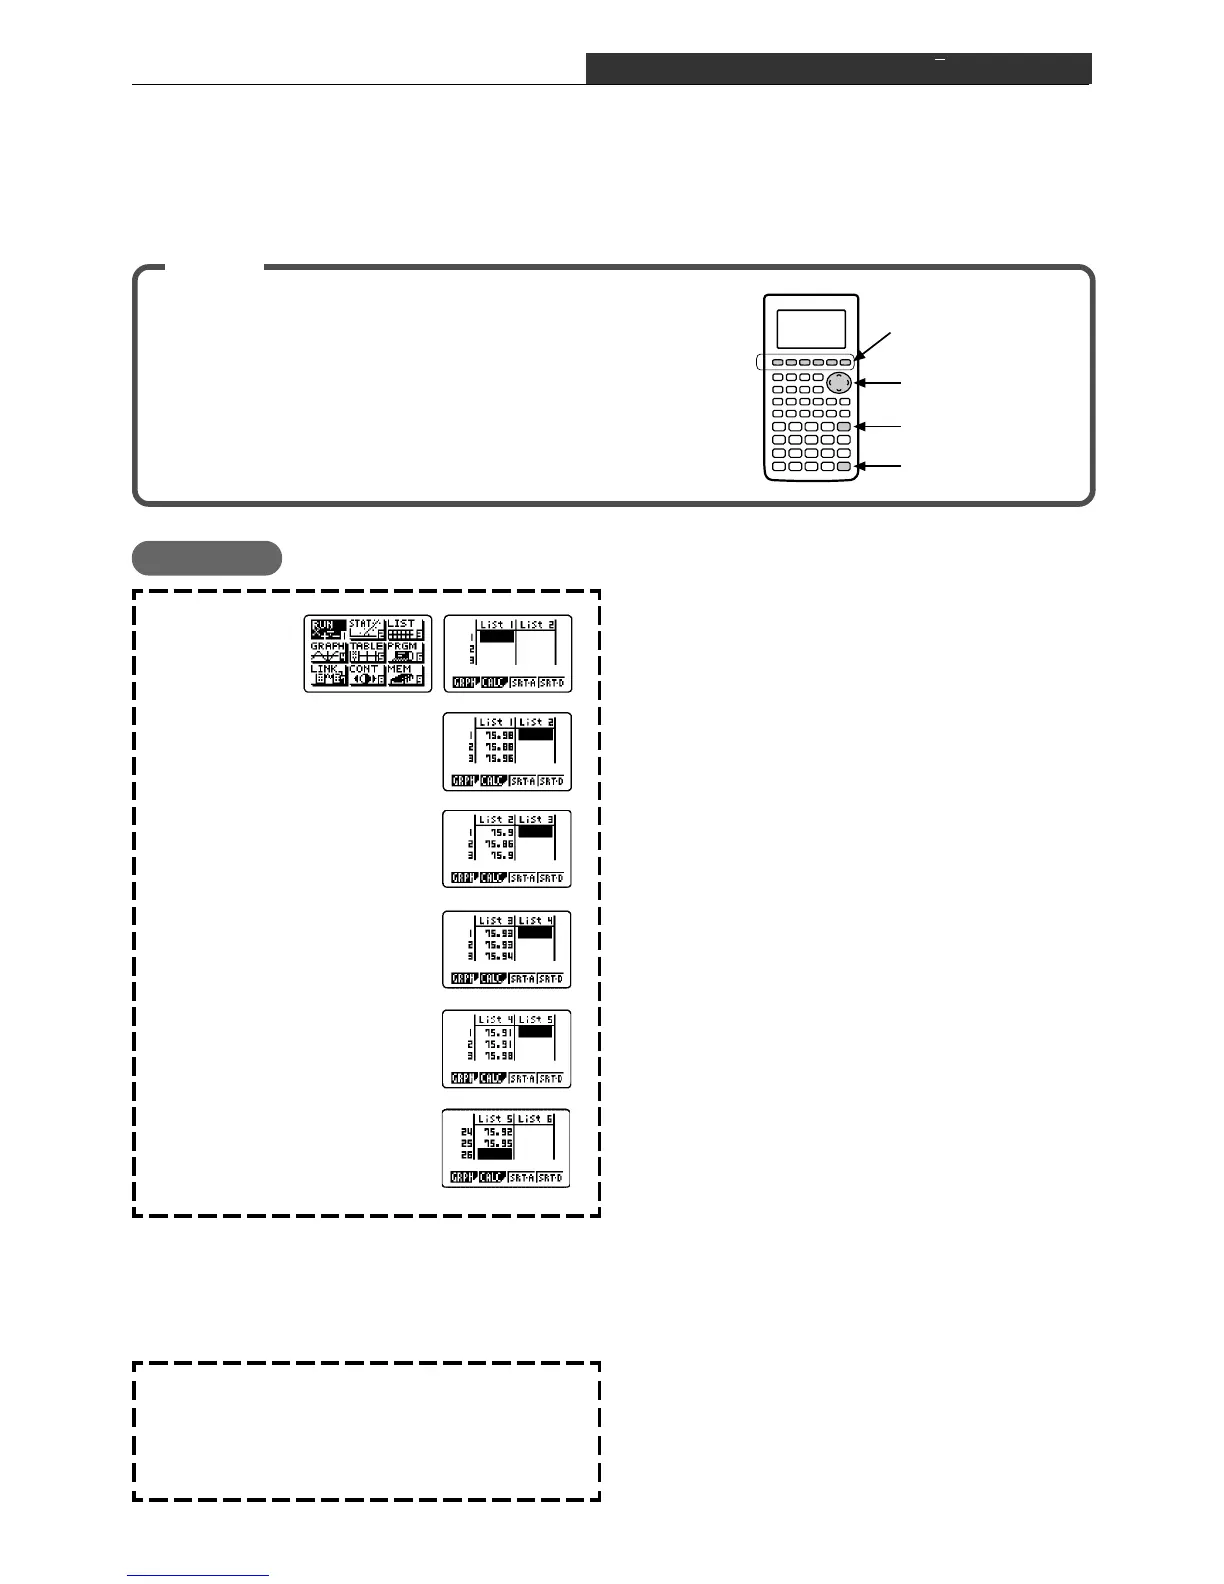
:From the Main Menu, enter the STAT Mode.
: Confirm that the cursor is located in the first line of
List 1.
:Input the 25 values for the x1 measurements into
List 1.
: Move the cursor to the first line of List 2.
:Input the 25 values for the x2 measurements into
List 2.
: Move the cursor to the first line of List 3.
:Input the 25 values for the x3 measurements into
List 3.
: Move the cursor to the first line of List 4.
:Input the 25 values for the x4 measurements into
List 4.
: Move the cursor to the first line of List 5.
:Input the 25 values for the x5 measurements into
List 5.
m 2
75.98
w75.88w• • •
e
75.90w75.86w• • •
e
75.93w75.93w• • •
e
75.91w75.91w• • •
e
76.01w75.95w• • •
Operation
*Instead of the manual input procedure used above, you can also use the program function to
input data. This comes in handy when you have a large number of values to input. See
“XRDATA Program Creation” for information about using a program.
m 6
c• • • • • • w
:From the Main Menu, enter the PRGM Mode.
:Run the program named “XRDATA”.
(*Select the program “XRDATA.”)

 Loading...


