– 63 –
Q-2 Component Quality Variation Control (X-R Control Chart)
m 2
eeeee
f
(K1(LIST)1(List) 1+2(List) 2+
3(List) 3+1(List) 4+1(List) 5
)/5w
m 1
K1(LIST)1(List) 6w
m 2
eeeee
76.01-75.90w
75.93-75.86w
• • • •
75.95
-75.83w
m 1
K1(LIST)1(List)
!-(Ans)a1(List) 5w
K1(LIST)[1(Seq)
T(X),T(X),1,25,
1)
a[[1(List) 1w
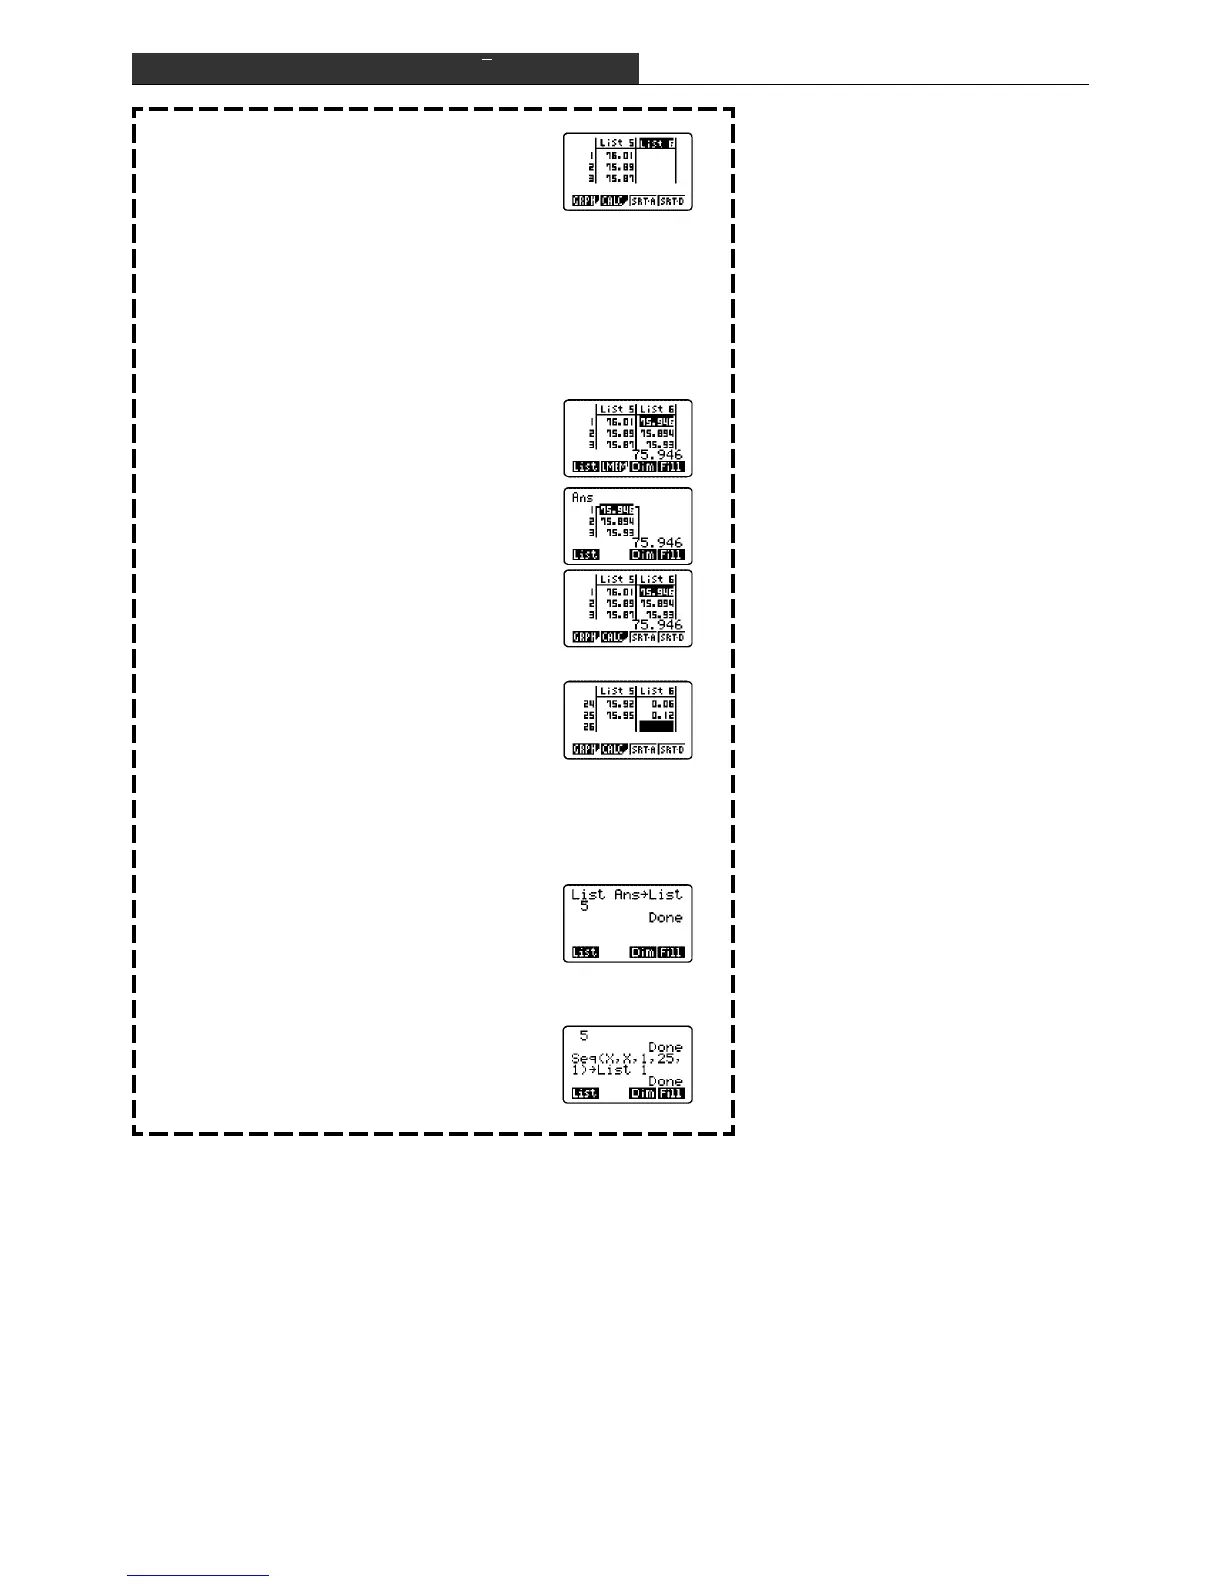
:From the Main Menu, enter the
STAT Mode.
: Move the cursor to the first line of
List 6.
: Select the title of List 6.
: Calculate mean values for entry into
List 6.
:From the Main Menu, enter the
RUN Mode.
: Save the mean values (List 6) in
List Ans memory.
:From the Main Menu, enter the
STAT Mode.
: Move the cursor to the first line of
List 6.
:Input the range of each group
(maximum value minus minimum
value).
:From the Main Menu, enter the
RUN Mode.
:Input the mean values (List Ans)
into List 5.
: Enter the group numbers in List 1.
Use Seq (sequence) function.
: Entry Syntax = variable, expression,
start item, end item, interval
:Execute.

 Loading...


