– 59 –
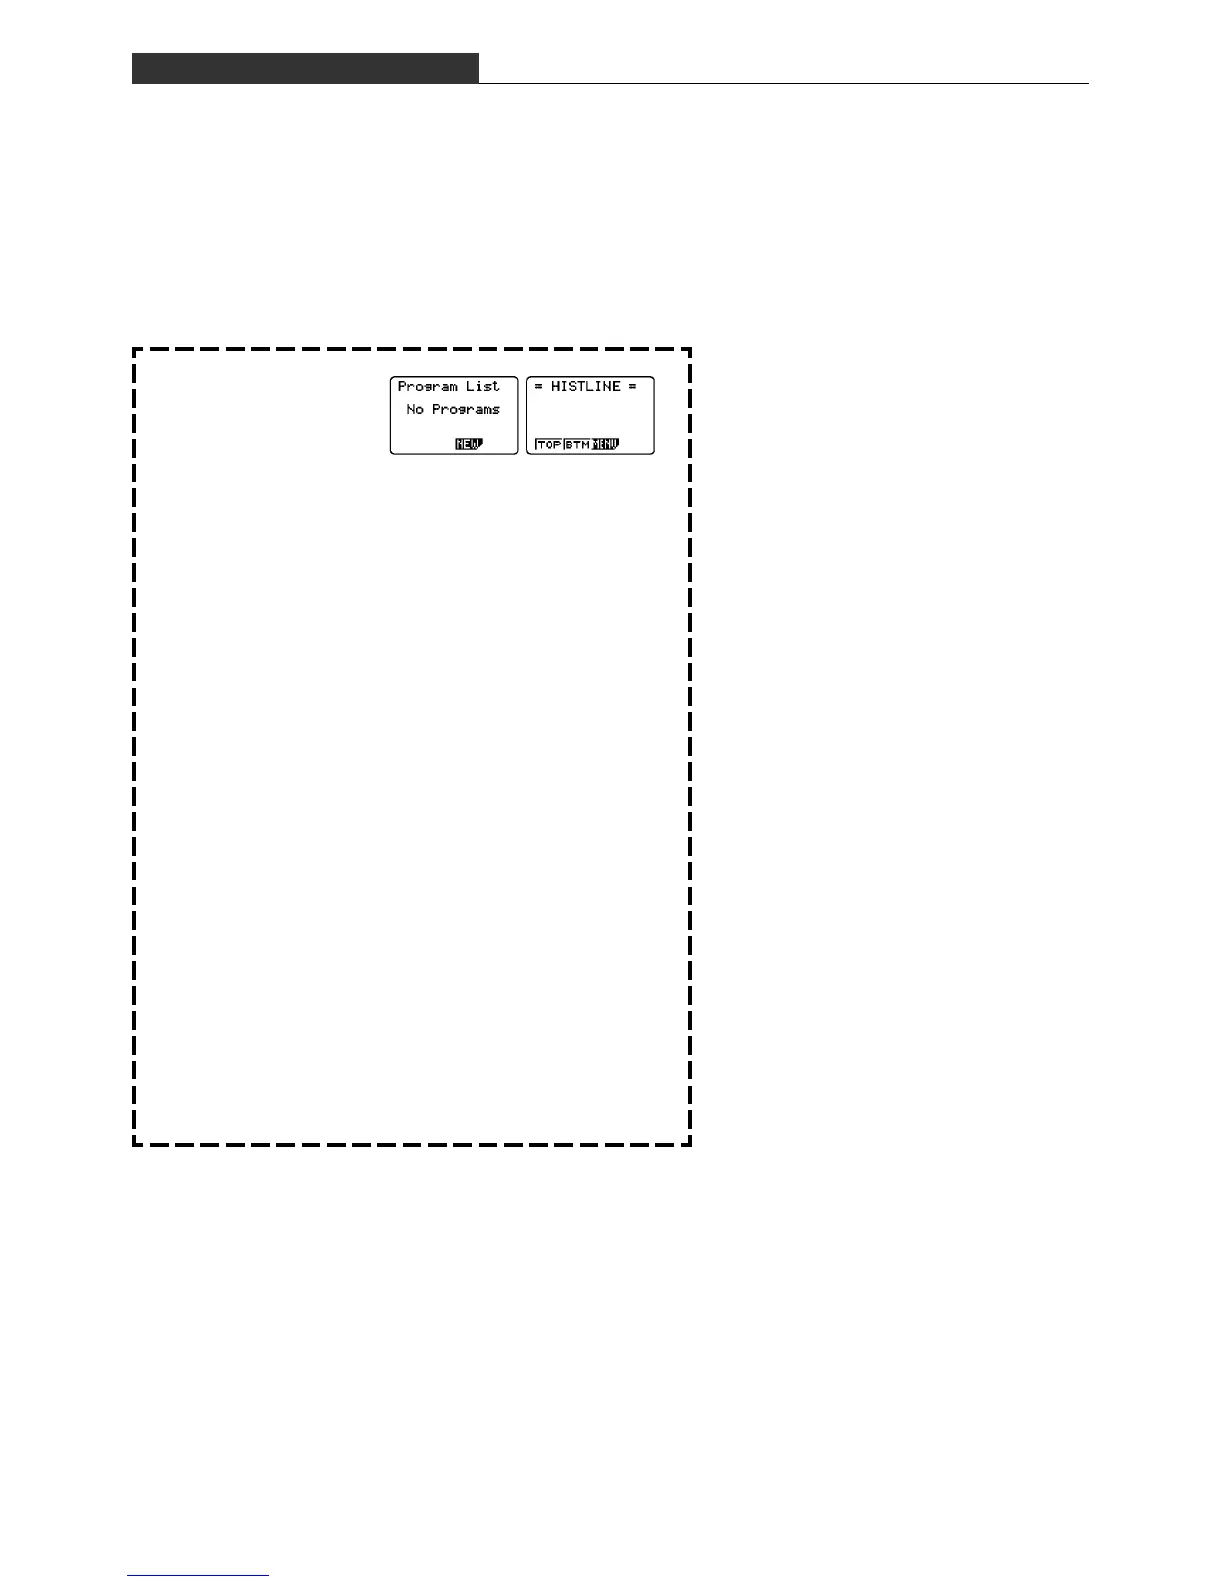
k HISTLINE Program Creation
Histogram: Broken line graph
The program creates a broken line graph by connecting the median values in each histogram
division with lines.
The broken line graph is based on the median value (horizontal axis) of each division in the
graph and the frequency of the data (vertical axis).
Q-1 Material Quality Control (Histogram)
:From the Main Menu, enter the PRGM
Mode.
: Select NEW PROGRAM.
:
Specify “HISTLINE” as the program name.
:Store the nine data ranges in List 2.
:In List 2, input 34.6, 34.7, ... 35.4.
:Input the frequency data into List 3.
:{1,7,11,17,24,20,12,6,2} → List 3
:Displays the contents of List 3 and
quits.
m 6
3(NEW)
M(H)((I)*(S)/(T)a(L)((I)
i(N)c(E)w
K1(LIST)[1(Seq)(T(X),
T(X),1,9,1)a[[1(List)
2
w
!J(PRGM)1(COM)[1(For)
1
aa((I)2(To) 9w
34.5+a((I)/10aK1(LIST)
1(List) 2!+([)a((I)!-(])
w
!J(PRGM)1(COM)[4(Next)w
!*({)1,7,11, 17,
24,20,12,6,2
!/(}) aK1(LIST)1(List) 3w
K1(LIST)1(List) 3wQQ

 Loading...


