– 4 –
5. Draw graph 2.
Press Q1(GRPH)1(GPH1).
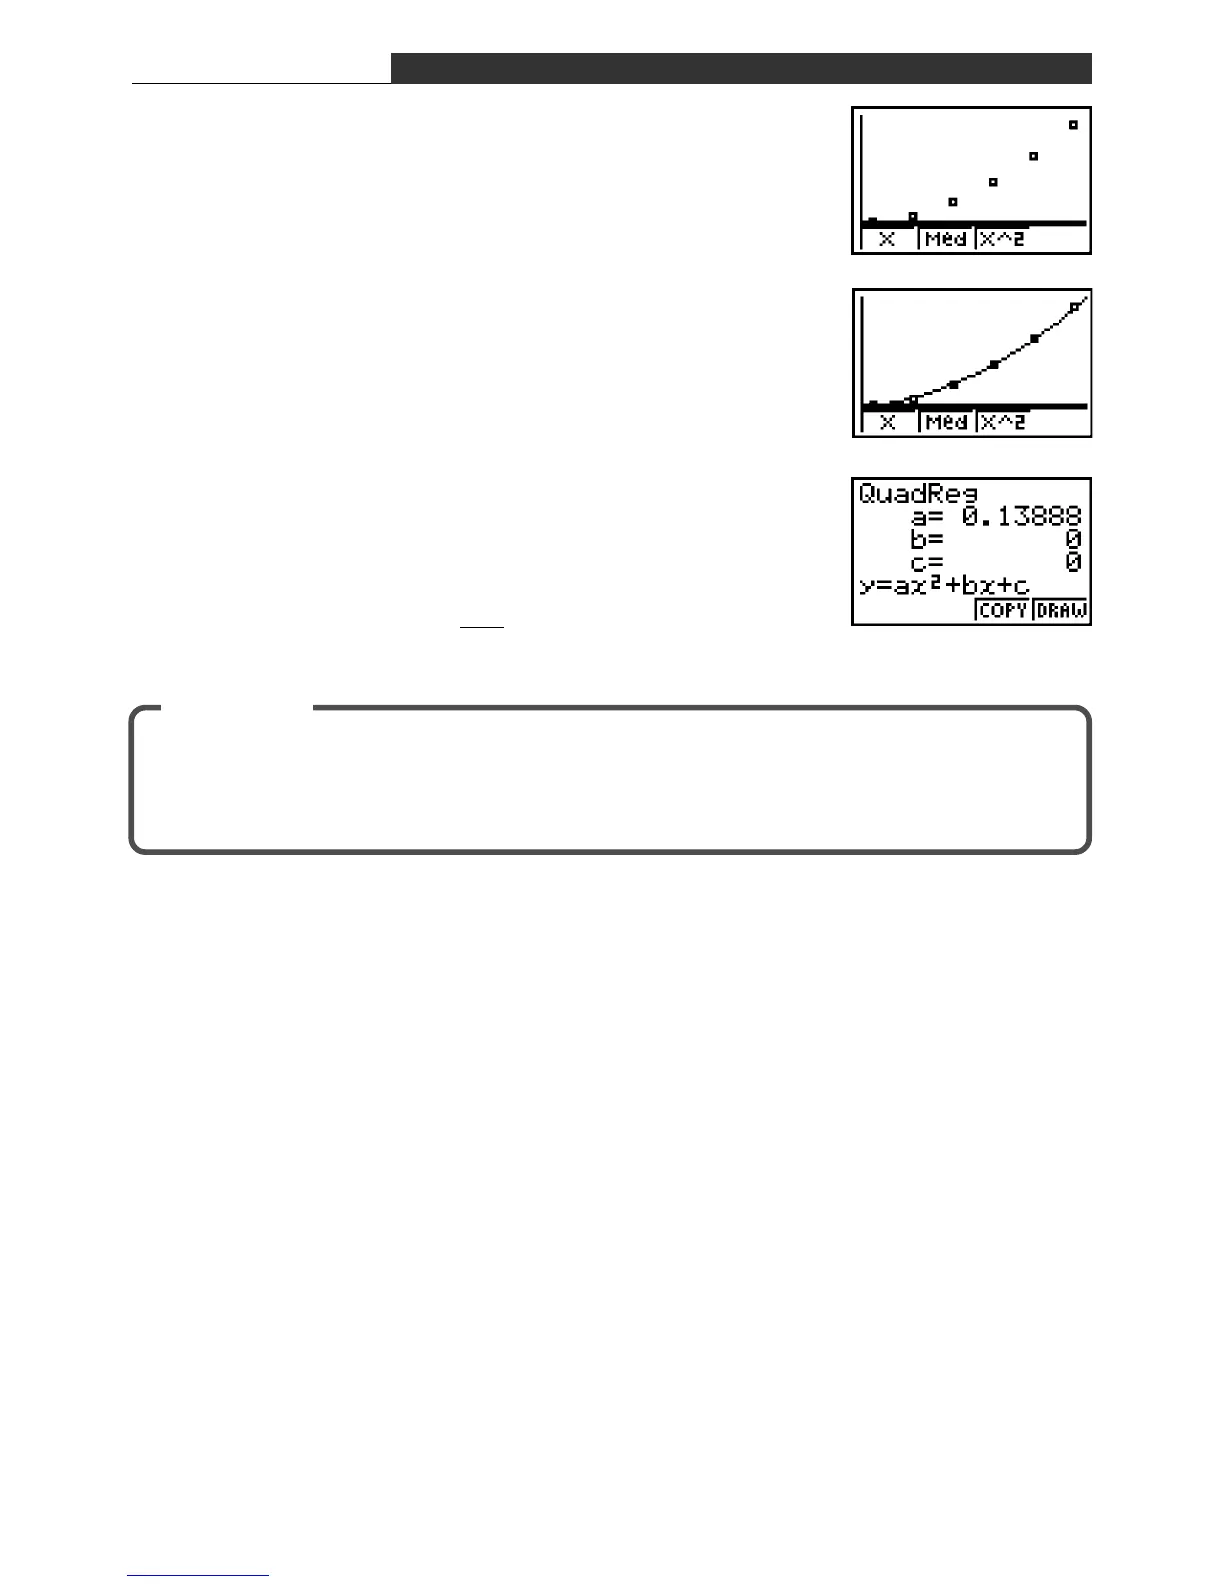
The graph that appears is a scatter diagram.
6. Perform quadratic regression.
Press 3(X^2) to perform quadratic regression and obtain
the function.
Press
4(DRAW) to draw the graph, which is overlaid onto
the scatter diagram as shown to the right.
7. Check the function.
Check 3(X^2) again to display the parameter screen shown
to the right. This provides us with the following function.
s = f(t) = 0.13888 t
2
=
1
t
2
7.2
In this exercise, the quadratic regression overlaid nicely onto the scatter diagram. When the
overlay is not as successful the one used here, try returning to the graph screen and using
linear regression, logarithmic regression, or some other type of regression.
Summary
E-2 Function Expressing the Relationship Between Time Taken and Distance Traveled

 Loading...


