– 33 –
1-2. Concentration-Mass Relationship (Scatter Diagram)
After preparing the graph with 1 (GRPH), press 1
(GPH1) to display the scatter graph, which shows changes in
concentration and mass.
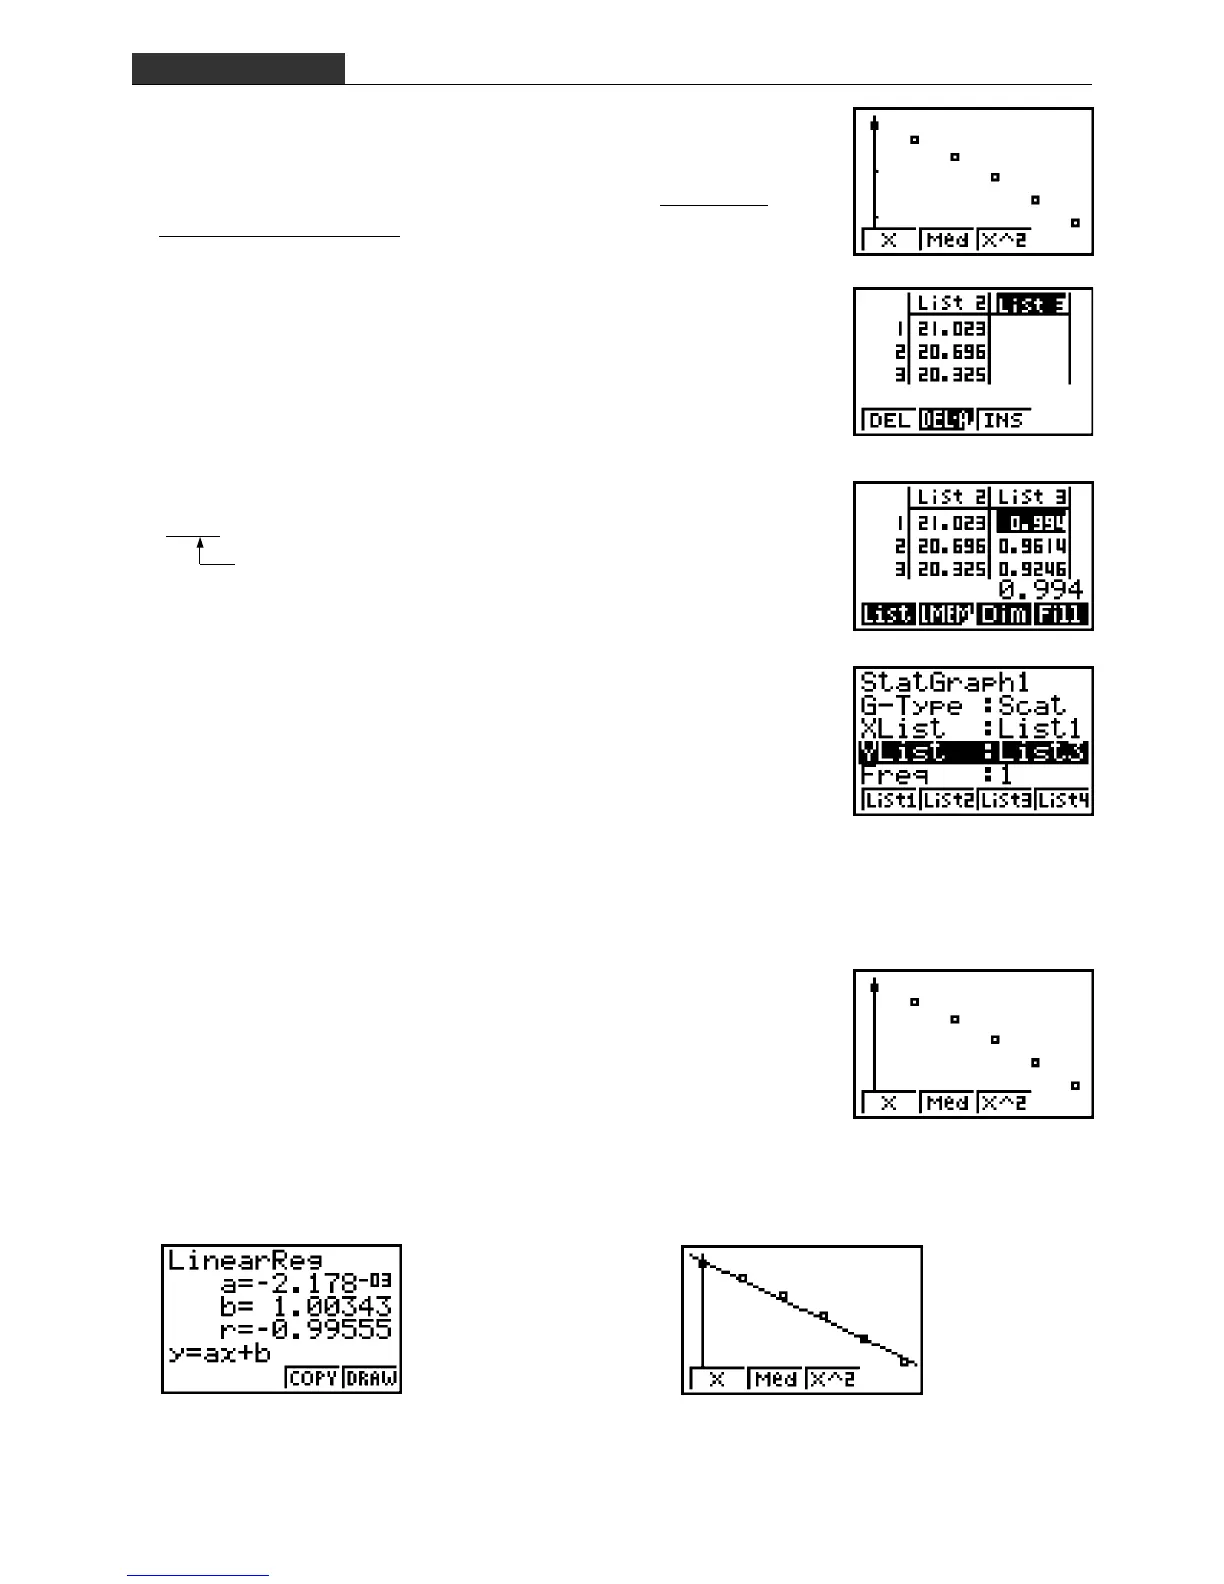
1-3. Density Calculation
Press Q, and then obtain the density in List 3.
Move the cursor to the List 3 name, and then input
Expression 1 as described below.
Press
K to enable input into the list name, and then input
(List 2 – 11.0205) ÷ (21.0233 – 11.0205)0.9940w.
1(LIST) 1(List)
1-4. Density-Concentration Relationship (Scatter Diagram)
Press Qand perform the following key operation to
specify concentration (List 1) for the horizontal axis and
density (List 3) for the vertical axis.
Press 1(GRPH)[4(SET). On the statistical graph
setup screen, specify List 3 for YList. (ccc
3(List3)w)
Pressing 1(GPH1) displays the scatter diagram.
EC-1 Density of a Liquid
1-5. Linear Regression
1(X) displays the linear regression
calculation result.
4(DRAW) draws the regression graph.
a, b are linear coefficients. r is the correlation coefficient.

 Loading...


