– 34 –
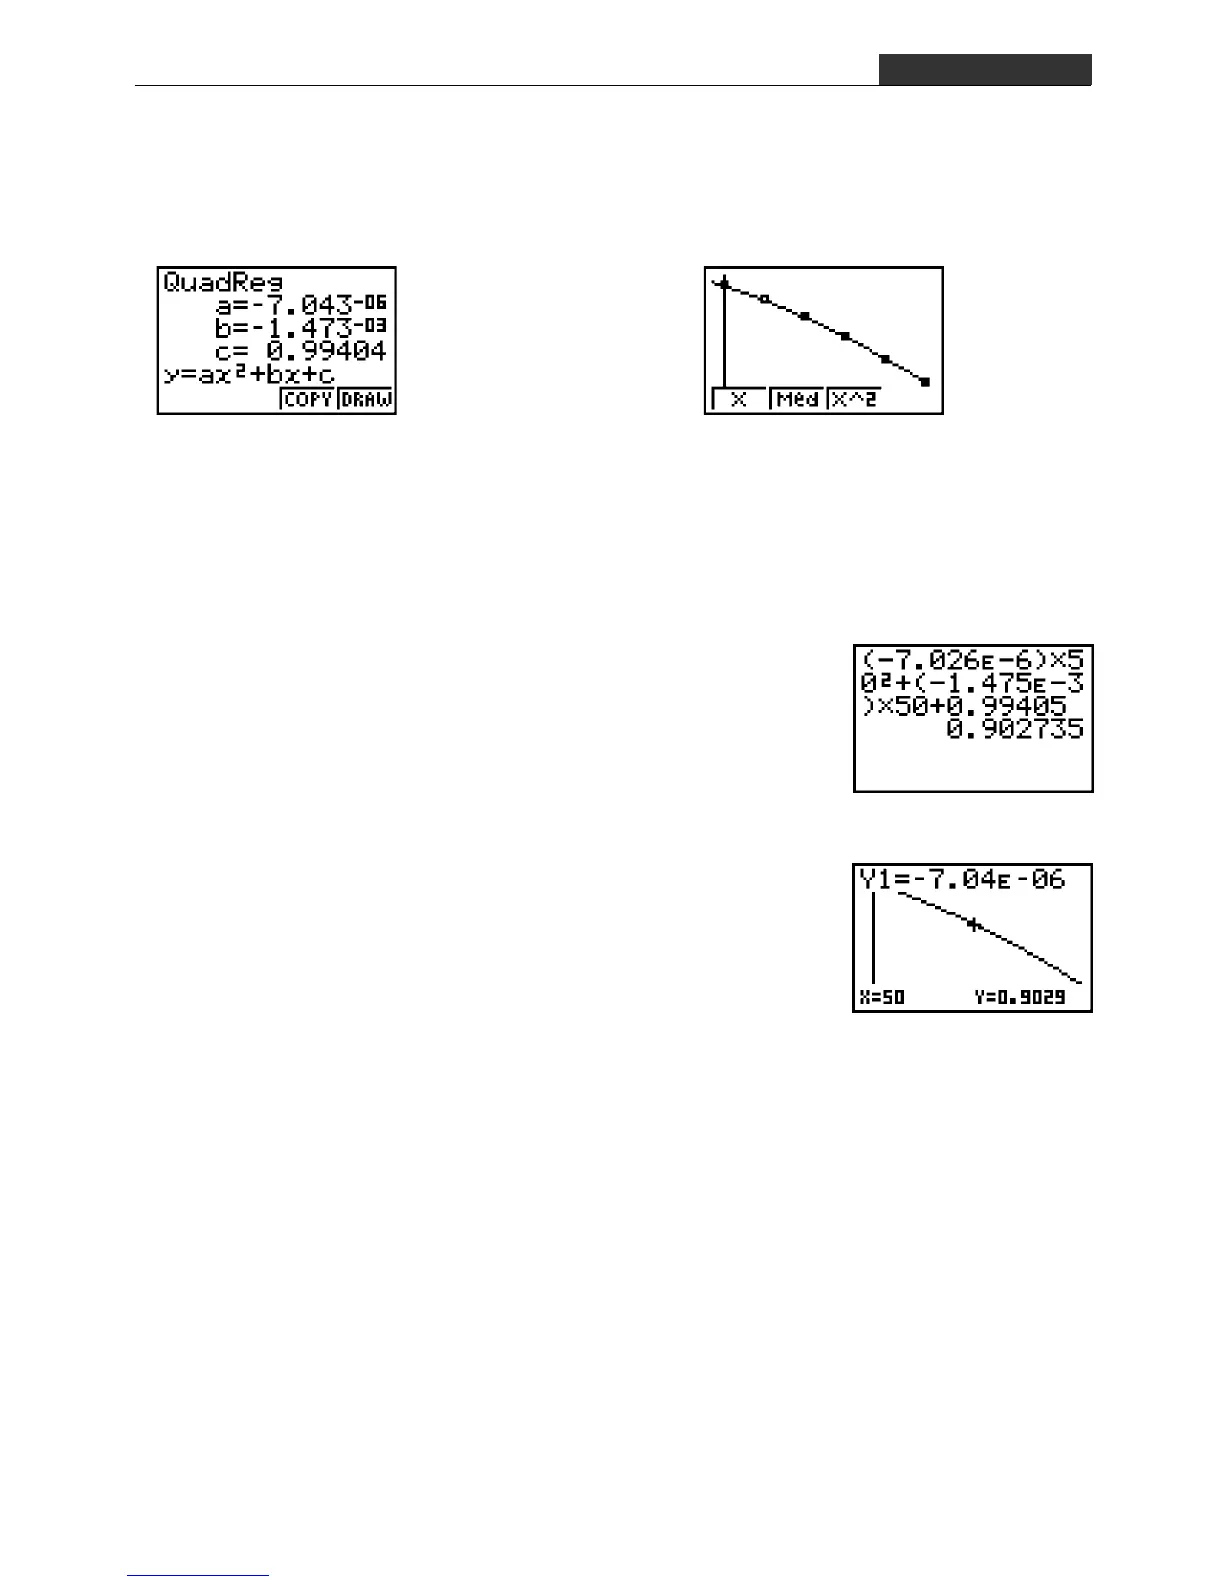
1-6. Quadratic Regression
After pressing Q to exit the graph screen, press 1(GRPH) 1(GPH1) again.
This shows that quadratic regression is appropriate for this exercise.
1-7. Data Estimation Using Regression
The results can be used to estimate the density of a 50% ethanol solution as follows.
(–7.026 10
–6
) 50
2
+ (–1.475 10
–3
) 50
+ 0.99405 = 0.902735
The above is performed in the RUN Mode.
1-8. Copy of Regression Graph to Graph Menu
You can use 3(COPY) to copy the nearby screen from
step 1-6 to the graph menu.
After using the graph menu to display a graph, you can use
the trace mode to determine the value of Y for any value of X.
Use !1(TRCE) to move the cursor. The sample screen shows the value of Y when
the cursor is moved to X = 50. This is virtually the same value obtained in step 1-7.
4(DRAW) draws the quadratic
regression graph.
EC-1 Density of a Liquid
Next, press 3(X^2) to display the
quadratic regression result.

 Loading...


