– 10 –
(3) This makes it possible to obtain flow velocity v in List 3.
Exercise 2
From the data in Excercise 1, graph the relationship between water depth h [cm] and flow
velocity v [cm/s].
Solution:
With the h [cm] on the horizontal axis and v [cm/s] on the vertical axis, point data points and
then draw a regression curve.
Graphic Calculator Operation
(1) From the Main Menu, enter the STAT Mode.
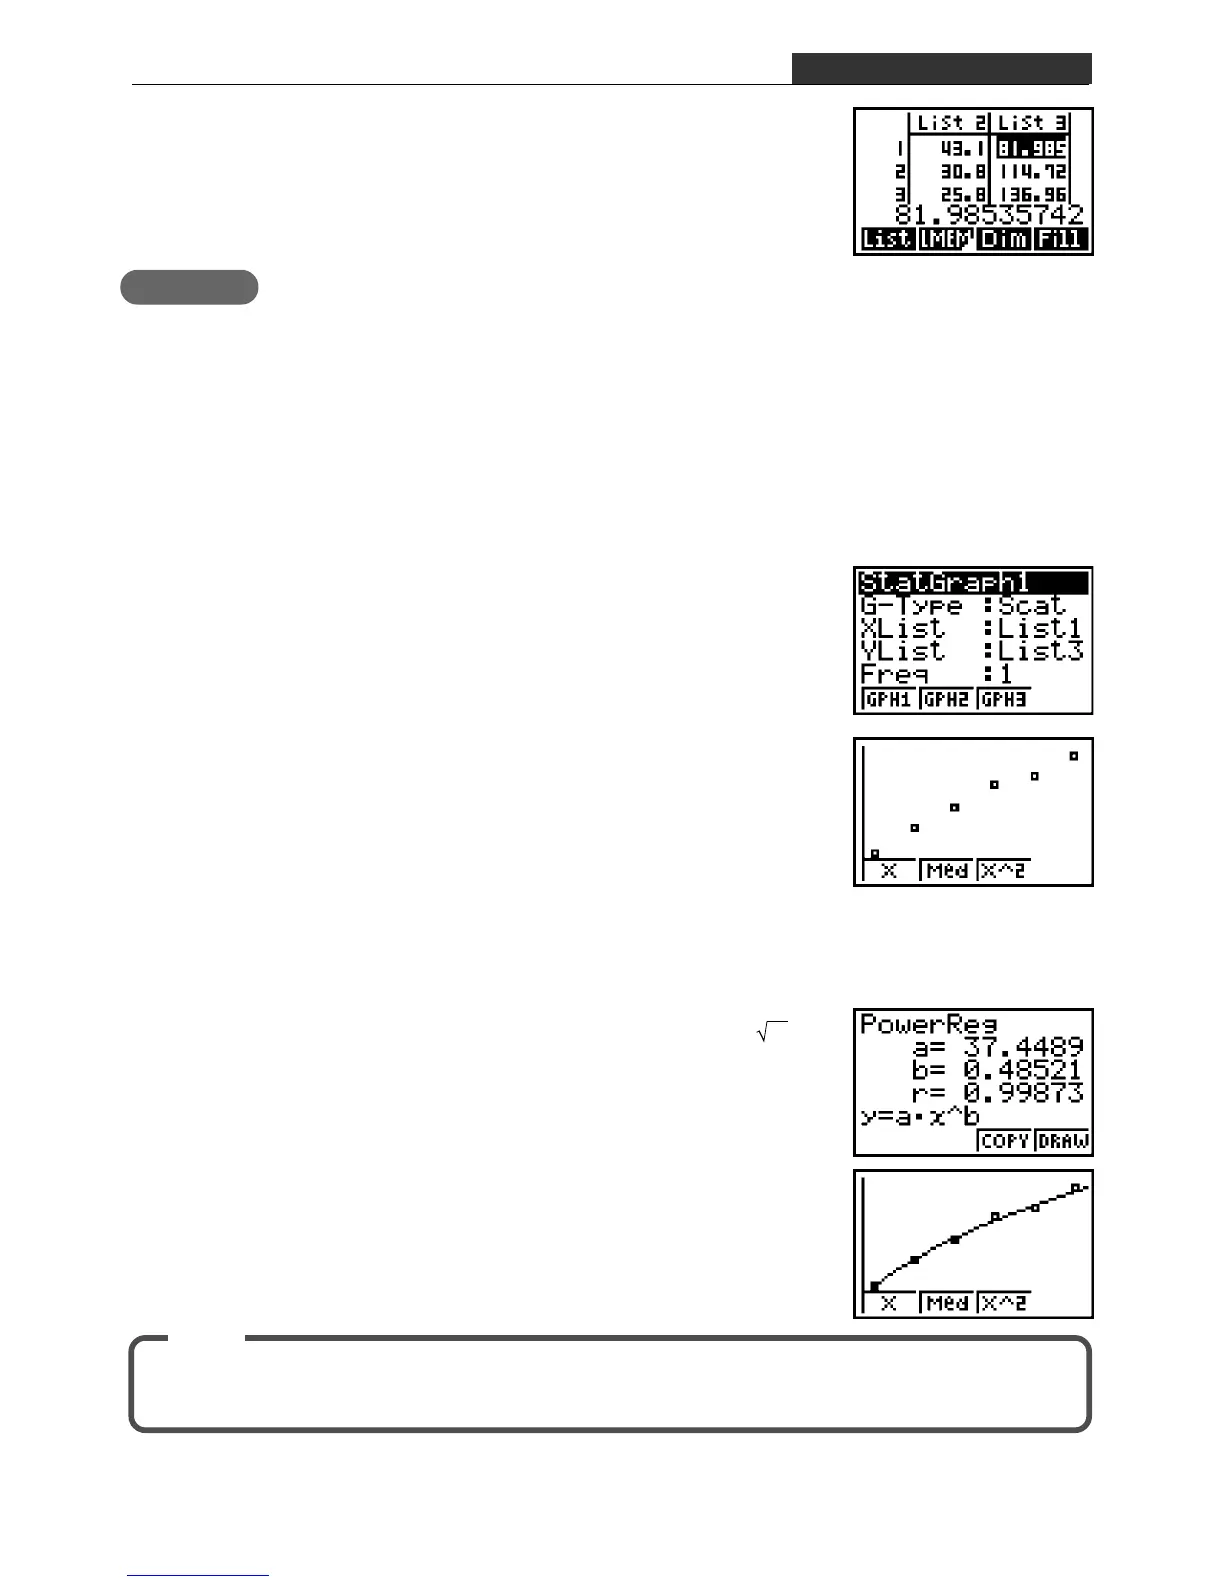
(2) Assign List 1 to the X-axis (XList) and List 3 to the Y-axis
(YList).
Use 1(GRPH) [ 4(SET) to configure the settings
shown in the illustration to the right.
Press Q 1(GRPH) 1(GPH1) to draw the graph.
(3) Regression by Function
The formula for this exercise can be expressed as v = 36.0 h ,
which is power regression.
Coefficients can be obtained by [3(Pwr).
4 (DRAW)
When the hole position is 0 [cm] in this exercise, the flow rate is 0. When h = 0 then v = 0.
Adding this data to the top of the list makes drawing of the regression curve easier.
Note
EM-1 Water Depth and Flow Velocity

 Loading...


