– 22 –
Experiment 1
Now let’s perform an experiment that actually checks the theory behind Ohm’s Law.
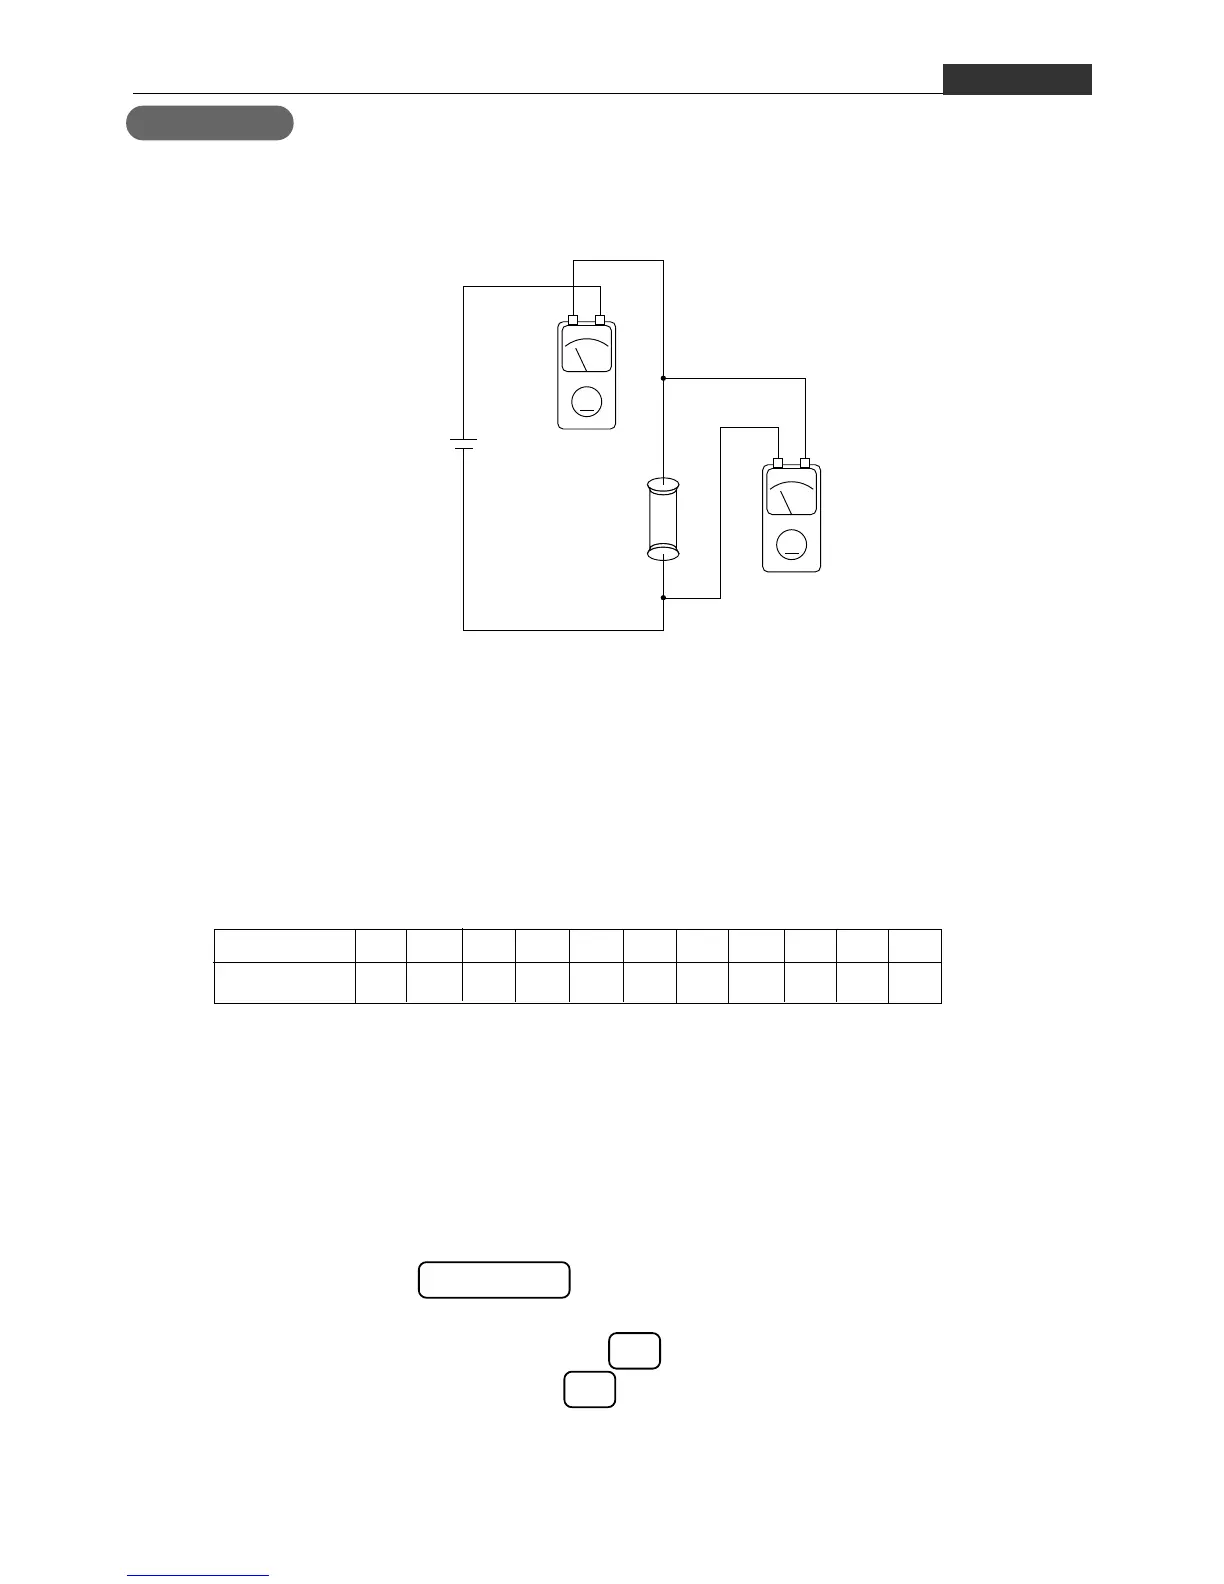
Prepare a circuit with 100Ω resistors like the one shown below.
Let’s try gradually increasing the voltage of the power supply. Measure voltage and current
on either side of the resistor. Raising voltage from 0V to 2V, in 0.2V steps, record the current
values.
• Do not raise power supply voltage higher than 6V!
• The resistor will become hot during this experiment. Be careful!
Experiment 1 Results
Analysis – Step 1
Use your graphic calculator to graph the results shown in the table. In the STAT Mode, input
the Voltage data into List 1, and the Current data into List 2. Input current value in (A) units
instead of (mA) units.
Analysis – Step 2
Now it’s time to move on to the next step, which is to determine the slope of this graph. Your
graphic calculator can calculate the slope for you automatically.
The slope of the graph is 1.02 × 10
-2
.
Analysis – Step 3
Now let’s recall our original expression: I = 1/R E. The slope we obtained should be
approximately the same as the value of 1/R . Let’s check if it is. Remember that the
resistance value we used in the experiment is 100Ω.
Voltage (V) 0 0.2 0.4 0.5 0.6 0.8 1.0 1.2 1.4 1.6 1.8
Current (mA) 0 2.0 4.0 6.0 8.1 10.2 12.1 14.2 16.2 18.2 20.3
EE-2 Ohm’s Law
A
V
Power Supply
Ammeter I (A)
Resistor R (Ω)
Voltmeter V (V)

 Loading...


